Design / build project: Guanella 1:1 ‘tuner balun for HF’ – #3

Third part in the series..


Common mode current measurement

Direct measurement of common mode current in an antenna system is the best indicator or whether there is a common mode current problem.

In Common mode current and coaxial feed lines, I mentioned that common mode current is easily measured.

80mIcm

Continue reading Design / build project: Guanella 1:1 ‘tuner balun for HF’ – #3

High altitude balloon – 2014-02-08

The Melbourne HAB team led by Andy, VK3YT, launched a balloon from Deniliquin in southern NSW on 08/02/2014.

It was my pleasure, and frustration to some extent, to receive some SSDV traffic from the balloon.

SSDV Live Images - Mozilla Firefox firefox 08/02/2014 , 14:05:53Above, the last pic before it burst at 37,000m (121,000′), what a great flight.

Copy was difficult, first 70cm SSDV data received at VK2OMD at a distance of 480km and due to frequency variation of about 50Hz superimposed on slower drift, packet decode rates were low.

More on the team’s work at http://projectspaceballoon.net .

Well done guys!

Design / build project: Guanella 1:1 ‘tuner balun’ for HF – #2

Second part in the series…


Common mode impedance

When baluns are used with open wire feed lines to wire antennas on HF, most commonly the main purpose is to suppress common mode current, to ensure that the current in one wire of the feed line is equal but opposite in direction to the other wire at that point.

Continue reading Design / build project: Guanella 1:1 ‘tuner balun’ for HF – #2

Design / build project: Guanella 1:1 ‘tuner balun’ for HF – #1

This is a project to design and build a Guanella 1:1 (current) balun for use on HF with wire antennas and an ATU.

First part in the series…


For use with a tuner, the most important design criteria are:

  • high voltage withstand;
  • high common mode impedance;
  • generous power handling given our 400W PEP limit, possibly 1kW in the future.

Continue reading Design / build project: Guanella 1:1 ‘tuner balun’ for HF – #1

WIA 4:1 current balun – further explanation

4-101a

I mentioned in my article WIA 4:1 current balun that the use of a single toroidal core in the above graphic compromises the balun. This article gives a simple, but more detailed explanation for the technically minded of why the shared magnetic circuit ruins the thing.

Continue reading WIA 4:1 current balun – further explanation

Windowed ladder line loss – G3TXQ #2

I tried to glean some useful information from G3TXQ’s measurements of windowed ladder line loss at Windowed ladder line loss – G3TXQ.

In reviewing his article today (05/02/14), there is new information on a further series of measurements of the same line.

450_mll

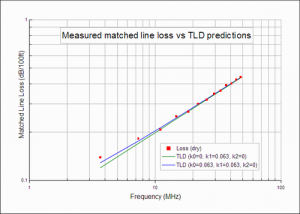
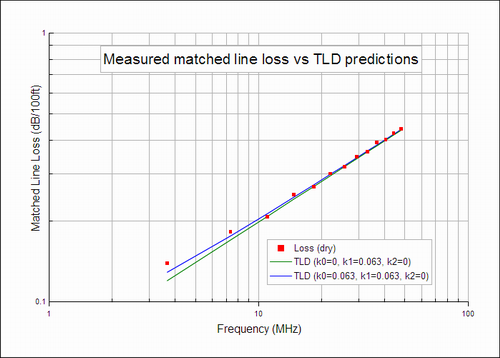
The shape and position of the two lines does not reconcile with the formulas stated, so I digitised the data points and analysed the data set to try to find the most appropriate model for the reported measurements. Note that although the chart above is in imperial units, my work is usually in ISO metric units, and usually basic units.

The digitised data points were converted to loss in dB/m, and fitted to the model MLL=k0+k1*f^0.5+k2*f using regression techniques. Note that the digitisation process introduces some noise, but it is estimated to be small compared to the noise in the underlying measurement data.

The coefficients k0, k1, k2 were reviewed to test that there was sufficient data to support the hypothesis that they were not zero, and all three passed that test, the standard error of the coefficient was significantly less than the coefficient. Note that k0 is not derived from a DC measurement of resistance as done by some modellers, but from the measurement data over the range of 3.6 to 48MHz in this case, and extrapolation beyond that frequency range increases uncertainty.

Clip 141

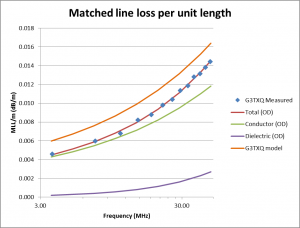
The above chart shows G3TXQ’s measurements as digitised from his published graph, and it shows the components of loss indicated from the model I built (the k0 component is allocated as conductor loss).

The “G3TXQ model” line is equivalent to his MLL=0.063+0.063*f^0.5 dB/100′ converted to dB/m, and as you can see it is not a good fit to the measurement data points, nor does MLL=0.063+0,063*f^0.5 dB/100′ reconcile with the blue line on G3TXQ’s chart earlier in this article.

G3TXQ’s measurement points (as digitised) are quite a good fit to the model MLL=0.001456+1.499e-6*f+5.631e-11*f dB/m where f is in Hz, and provide a good predictor of MLL over 3.6 to 48MHz.


Foundation manual on power measurement

My article Foundation watts explained triggered some discussion on the thorny issue of compliance with power limits of the LCD.

One correspondent was confident that the Foundation candidates are properly trained, which leads to examining the training materials.

SWRMeter

Continue reading Foundation manual on power measurement

Cobwebb antenna impedance matching scheme

From time to time, correspondents have asked how the Cobwebb antenna works, and particularly how the impedance matching scheme works.

Firstly, what is the Cobwebb?

It is an innovative antenna for small spaces, quite compact and as I recall originally intended to cover five amateur bands from 20-10m.

Continue reading Cobwebb antenna impedance matching scheme