The article Can we find the noise power captured by a 50Ω antenna and ambient noise figure using a SDR or spectrum analyser? gave a brief explanation of Quasi Peak (QP) as applied to noise measurement.
I say “noise measurement” loosely, because since noise is a random phenomena, what we do is to sample the phenomena over some period of time, and if we were to sample it again, whilst it might seem to be the ‘same’ noise, the random events are new, they are a new set of samples, and summary of them is new. This contributes to the large variance observed in noise ‘measurement’.
QP is commonly used to express the magnitude of noise in the context of emissions and interference potential. QP derives from a very old CCIR recommendation describing the response of a noise measurement instrument. The recommendation included a specified meter response to short tone bursts. The QP detector has a slowed rise time, and slower decay time, so it under captures isolated very fast impulses, but accumulates high repetition impulses. The QP response reads higher than an average power detector, and lower than a peak power detector. My experience is that QP is about 4-5dB higher than average power on white noise, and typically around 6-7dB higher on off air noise with little impulse noise, but high impulse noise can result in a much higher QP reading. For more information, see (ITU-R. 1986).
Most EMC receivers and Spectrum Analysers with EMC feature have a QP ‘detector’. Communications receiver S meters often have a nearly QP response.
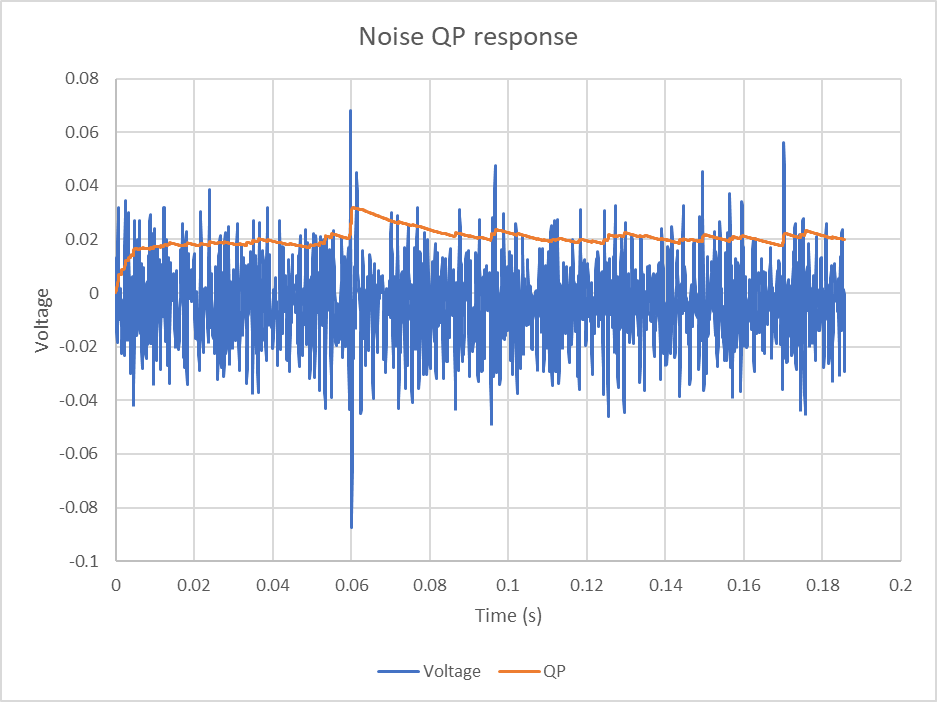
Above is a plot of sampled noise and QP calculation (the QP ‘detector’) made during development of FSM (Field Strength Meter) software. Observe that impulses have effect but the QP is closer to average power than repetitive peaks, much closer than infrequent impulses.
Note that Peak/Avg power for a sine wave is 3dB, QP/AVG power for a sine wave is almost 3dB.
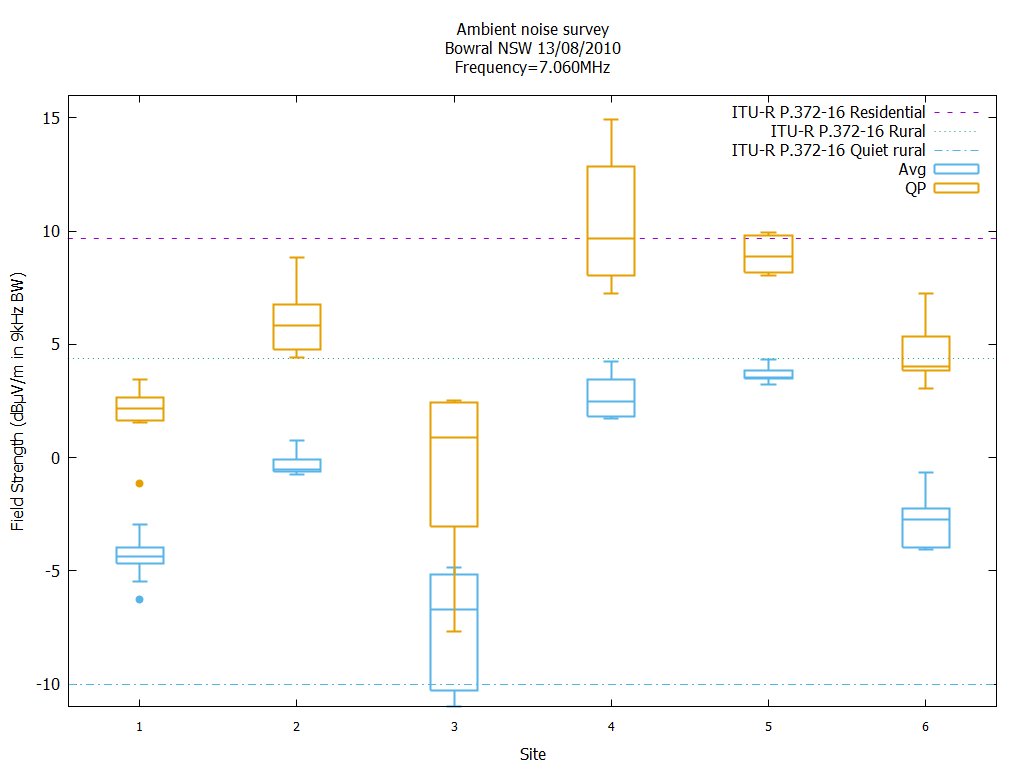
Above is a survey from quite some years ago, but it shows the variation in measurements around the neighborhood. Plotted are fields strengths corresponding to average power and quasi peak power.
Note the variance in measurement at each of the measurement sites, the box shows the Inter Quartile Range which varies from site to site. The difference in median values (the horizontal line inside the box) varies from site to site, around 7 to 8dB.
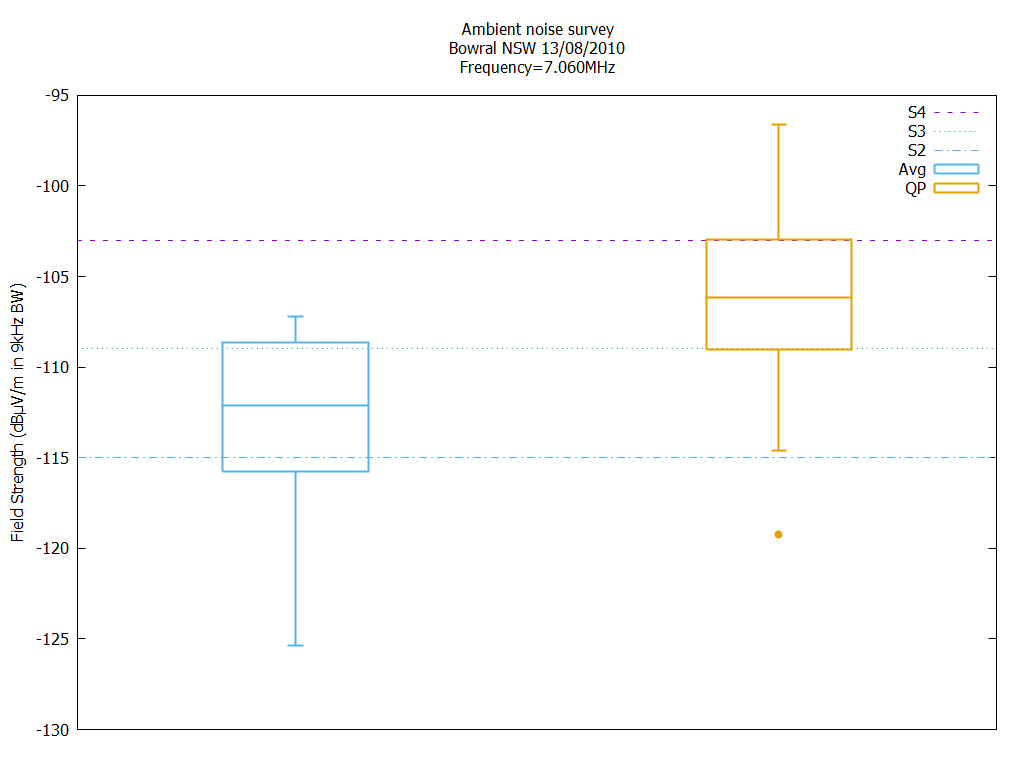
Above is a plot of all the survey measurements. It is expressed here as average power received in 2kHz bandwidth, the median QP sits at about S3.5 in ham S meter ‘convention’ (50µV or -73dBm for S9, 6dB per S point). Note that average is about 6dB lower than QP, QP IQR is lower at about 6dB (30 observations).
Though S meters are common, S meters that are reasonably accurate in terms of that convention are uncommon. S meters measuring ambient noise are likely to have a near QP response.
SDR receivers might be better in calibration accuracy.
References / links
- ITU-R. Aug 2022. Recommendation ITU-R P.372-16 (08/2022) Radio noise.
- ITU-R. 1986. Recommendation ITU-R BS.468-4 (1986) Measurement of audio-frequency noise voltage level in sound broadcasting.