Valve datasheets often give one to few suggested sets of operating parameters for a valve in one several modes, and designers are left to sort of interpolate or extrapolate to their own set of parameters, eg loaded power supply voltage.
This article is a walk through and comparison of RF Power Amplifier Tube Performance Computer applied to the subject scenario.
Let’s extract from the Mullard datasheet.
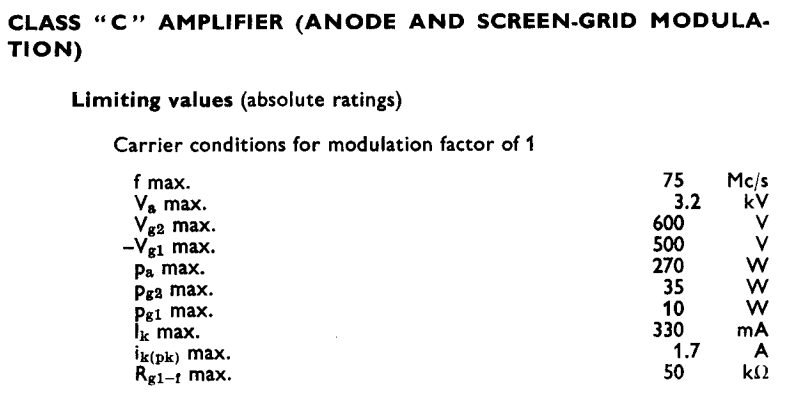
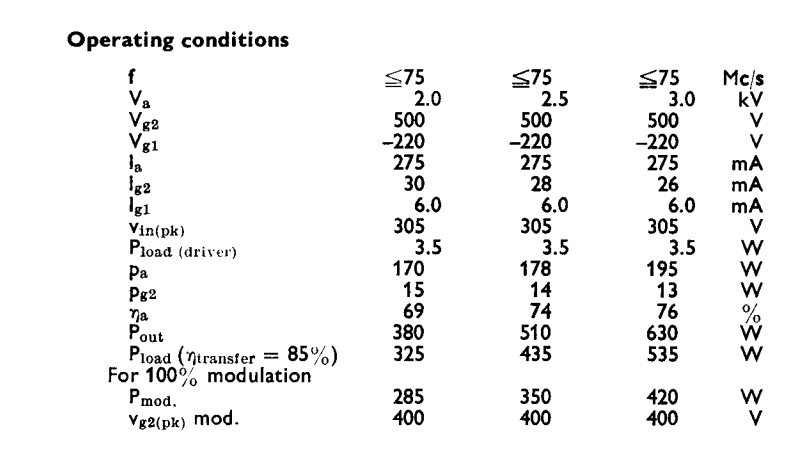
We will use the Va=3kV scenario for this comparison.
First step is an initial estimate of the load line.
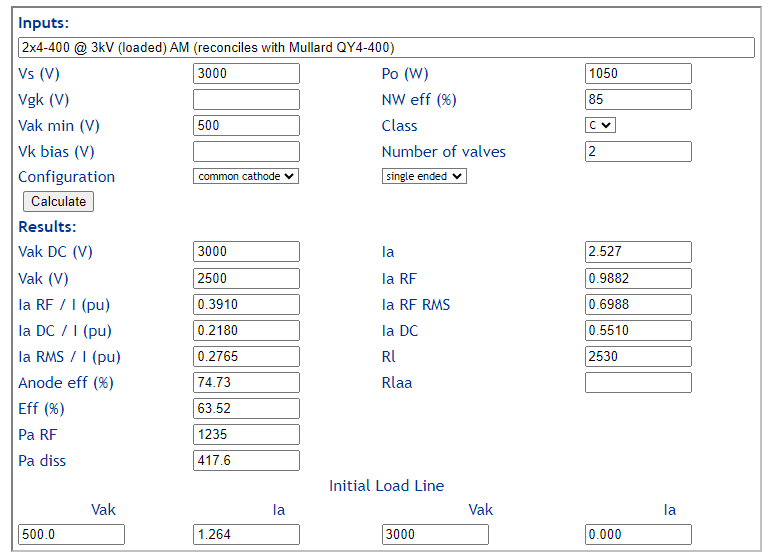
Above is the result from Calculate initial load line of valve RF amplifier.
Now let’s plot the load line.

Above, the anode characteristic for Vg2=500V with load line, we can now layoff Ia vs Vgk along the load line.

Above is the Ia,Vgk data pairs entered into the RFPATPC spreadsheet, and plots of the data points and cubic spline interpolation which will be used to construct the anode current waveform for Fourier analysis.
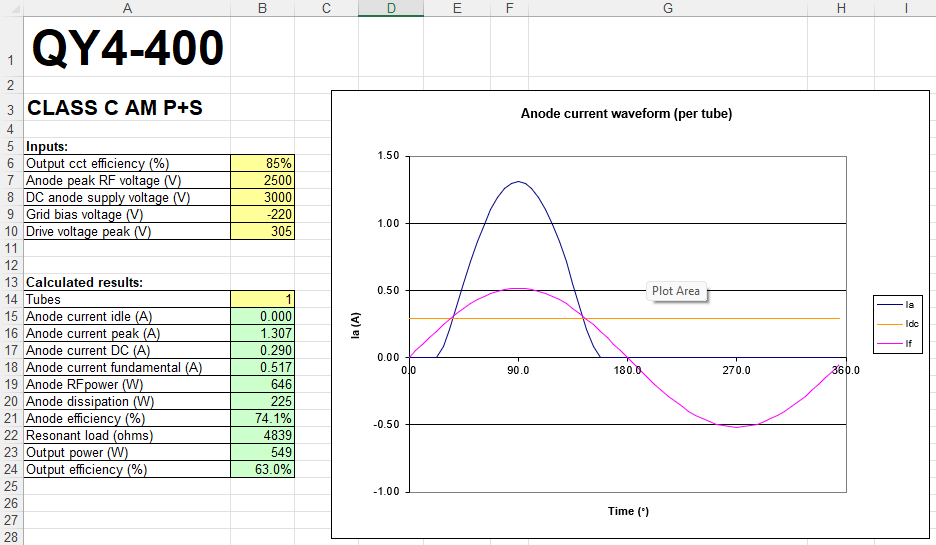
Above is the anode current waveform, and the values calculated from Fourier analysis of the waveform.
These reconcile well with the datasheet. Note that the datasheet uses 85% efficiency for the output network, hams tend to be less concerned with harmonic suppression and would run lower loaded Q of the output network leading to efficiencies better than 90%, perhaps as high as 95%. So, the datasheet is a bit of an underestimate of typical ham design.
The tools can also be used for linear classes.
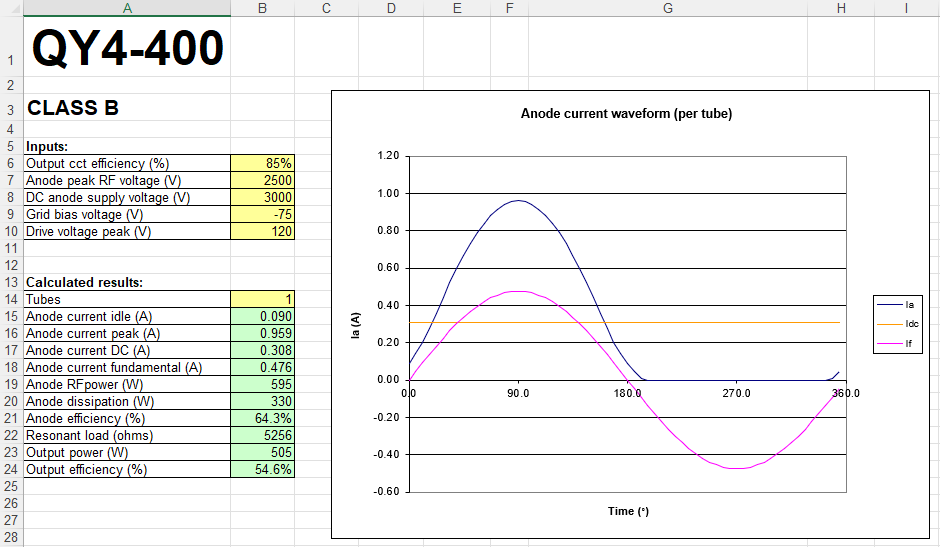
Above is an example where the bias and drive were adjusted for Class B operation with 90mA idle current. Note the reduced efficiency under these conditions.