NanoVNA – Port 1 port extension

A VNA is usually calibrated by the user at some chosen reference plane using standard parts, commonly an open circuit, short circuit, and nominal (50Ω) load. As a result of this OSL calibration, the VNA is able to correct measured s11 to that reference plane, and display its results wrt that reference plane.

There are occasions where it is not possible, or not convenient to locate the DUT at the reference plane. This article discusses the problem created, and some solutions that might give acceptable accuracy for the application at hand.

The discussion assumes the VNA is calibrated for nominal 50+j0Ω.

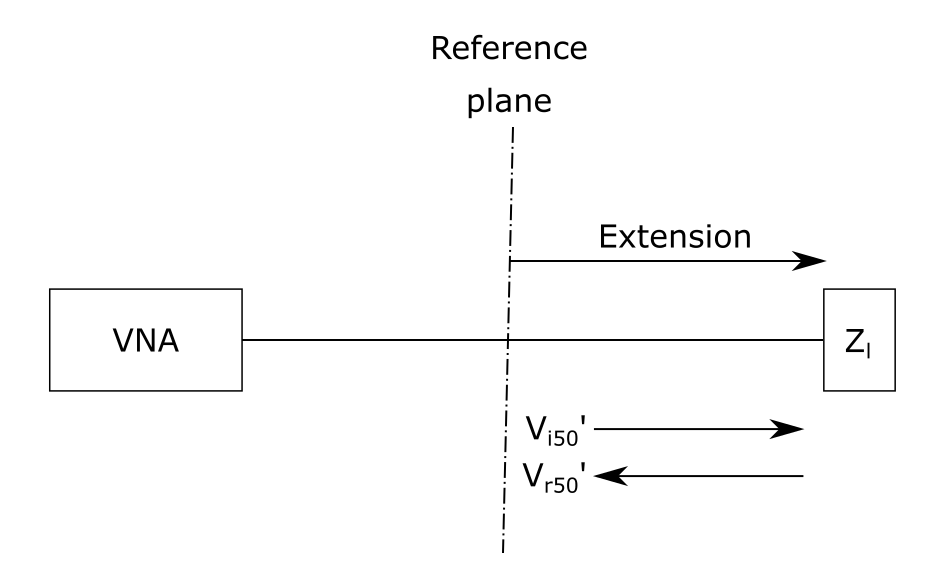
Above is a diagram of a configuration where the unknown Zl is not located exactly at the reference plane, but at some extension. Continue reading NanoVNA – Port 1 port extension

NanoVNA – DiSlord NanoVNA-D v1.1.00 & NanoVNA-App-v1.1.209-OD10 calibration

This article explains the interworking of DiSlord NanoVNA-D v1.1.00 firmware and NanoVNA-App-v1.1.209-OD10 with respect to calibration.

This applies to the specific combination of versions of firmware and software client, do not assume it applies to other combinations.

DiSlord NanoVNA-D v1.1.00 firmware supports a scan_bin command where bit 3 of the outmask field is used to request raw measurement data, ie uncorrected measurements.

NanoVNA-App-v1.1.209-OD10 supports exploitation of that capability when it recognises that firmware version and command support.

Above, NanoVNA-App-v1.1.209-OD10  has a dropdown list to choose calibration mode. Continue reading NanoVNA – DiSlord NanoVNA-D v1.1.00 & NanoVNA-App-v1.1.209-OD10 calibration

NanoVNA – trying the DiSlord built in cable length measurement feature

A recent discussion online on the use of this facility in some model or other NanoVNA/firmware combination quickly ran to over 100 posts, and you might think it is really difficult, or plain does not work.

Let me say I am leery of built in features that invite users to perform something they do not understand, and may misinterpret the outcome.

Lots of the discussion ran to explaining why measurement of a sample of coax  would be out by 5% or more, lots of pseudo tech discussion about age related, contamination related, quality related explanations for the measurement, things which might cause the measurer to condemn the sample, to discard it.

Well, you would want to be pretty confident in yourself to make that call, given that the explanation might well be measurement error.

I don’t use this facility, so I am quite unfamiliar with it, and there is no documentation, so one make make an informed guess as to how to use it.

Let’s measure… Continue reading NanoVNA – trying the DiSlord built in cable length measurement feature

NanoVNA phase confusion

One sees online discussions and videos where phase from a NanoVNA display is central to the subject, and more often than not, the use is quite confused.

Let’s look at some examples.

Example 1

A poster advising on how to measure inductance using a NanoVNA posted a .s1p file of his measurements of a SM inductor of nominally 4.7µH from 1-5MHz and discussed the use of phase in determining the inductance.

Above is a plot of the data in the VNWA PC client. Four values are plotted: Continue reading NanoVNA phase confusion

NanoVNA-H4 – inductor challenge – part 6

This article is part of a series discussing inductors, their characteristics, and measurement, continuing from NanoVNA-H4 – inductor challenge – part 5. The previous articles have discussed these matters in the context of an air cored solenoid, this article moves on to inductors with a magnetic core.

A magnetic core increases the flux Φ due to a current flowing in the inductor, and since \(L \propto \phi\), the magnetic core increases inductance.

Magnetic core materials are not usually linear, they exhibit saturation and hysteresis (which brings core loss), and changing magnetic field induces eddy currents in the material which also brings core loss.

The B-H curve relates flux density to magnetising force, and as mentioned, the underlying material is non-linear and exhibits saturation (where at some point, B increases very little for increased H).

Above is a generic BH curve for magnetic core material. It shows saturation and hysteresis. Note that saturation (Bs) is total saturation of the core, but saturation begins at half that flux density in this case. Continue reading NanoVNA-H4 – inductor challenge – part 6

NanoVNA-H4 – inductor challenge – part 5

NanoVNA-H4 – inductor challenge – part 4 discussed measurement of inductance of the example air cored solenoid inductor.

The other property of an inductor that if often sought is the Q factor (or simply Q). Q factor derives from “quality factor”, higher values of Q are due to lower resistance for the same inductance… so you might regard them as a higher quality inductor, lower loss relatively, and in resonant circuits, higher Q inductors yielded a narrower response.

Let’s visit the Q factor and measurements / plots of Q. Continue reading NanoVNA-H4 – inductor challenge – part 5

NanoVNA-H4 – inductor challenge – part 4

NanoVNA-H4 – inductor challenge – part 3 visited the basic model of an inductor as comprising a series resistance and inductance, and its failure above perhaps SRF/5, and proposed a simple extension that may give useful prediction of impedance up to SRF and a little above.

Importantly though is that it showed that measurement of Z departed from a frequency independent inductance \(X \propto f\) and some small frequency dependent resistance \(R \propto \sqrt f\) above perhaps 15% of SRF… and so we cannot simply infer the value of the underlying inductance from Z at an arbitrary frequency.

Where \(X \propto f\) we can say that \(L=\frac{X}{2 \pi f}\) (where X is the imaginary part of measured Z).

Let’s return to the plot of L from NanoVNA-App’s interpretation of measured Z.

At lower frequencies where the plotted value of L is independent of frequency (ie a horizontal line) we can infer that the underlying inductance of the inductor is that value, 20µH in this case (an air cored solenoid). Continue reading NanoVNA-H4 – inductor challenge – part 4

NanoVNA-H4 – inductor challenge – part 3

NanoVNA-H4 – inductor challenge – part 2 showed how to approximately undo the transmission line effects of the measurement fixture to improve accuracy of measurement of the coil end to end.

Let’s look at the impedance plot at the coil ends.

So, it is clear we have a device with multiple resonances… a resonator in broad terms and representing it as a fixed inductance in series with some small resistance is quite inadequate for the frequency range above. Continue reading NanoVNA-H4 – inductor challenge – part 3

NanoVNA-H4 – inductor challenge – part 2

Recall the fixture from NanoVNA-H4 – inductor challenge – part 1:

NanoVNA-H4 – inductor challenge – part 1 stated:

In fact, we have the underlying inductor connected by 35mm of 570Ω two wire transmission line, so there is a small amount of impedance transformation (which could be approximately corrected in this case by setting port extension to 20ps… but that is not done for this article).

Let’s explore that using Simsmith. Continue reading NanoVNA-H4 – inductor challenge – part 2

NanoVNA-H4 – inductor challenge -part 1

Let’s explore measurement of a test inductor with the NanoVNA.

Above is the test inductor, enamelled wire on an acrylic tube.

Let’s hook it up to the NanoVNA for an s11 reflection measurement of Z.

Above, one wire is plugged into the centre pin of the top / Port 1 connector. The other wire is clamped to the external male threads of the Port 2 connector using a plastic clothes peg. Note that this VNA is modified, it has the two coax outers bonded together.

In fact, we have the underlying inductor connected by 35mm of 570Ω two wire transmission line, so there is a small amount of impedance transformation (which could be approximately corrected in this case by setting port extension to 20ps… but that is not done for this article).

An ideal inductor of 20µH would have zero resistance and reactance proportional to frequency.

Let’s look at measured impedance from 1-5MHz. My fork of NanoVNA-App will by used.

Above, measured Z of this practical inductor looks a bit like that, very low R and X∝f.

Above, we can plot the equivalent series inductance from the measurement, and it looks like 20µH independent of frequency.

That all looks pretty good… but let’s measure Z of this practical inductor from 1-200MHz.

Above, this is nothing like zero resistance and reactance proportional to frequency.

What is going on?

Continued at NanoVNA-H4 – inductor challenge – part 2