Is |Z| a really useful metric for optimising antenna systems?

One often sees some misconceptions about the relationship between VSWR and impedance. The maths of the relation is explained at Telegrapher’s Equation. The relationship is not trivial and will challenge readers who do not understand complex numbers and exponentials.

Even if you do not have the requisite maths, the following examples may dispel some wooly thinking.

By example

|Z|=50

I have created a SimNEC model to simulate a load Z of specified |Z|, and to sweep the phase of Z from -90 to +90°, and to display VSWR50.

Above is the result where |Z|=50 and for phase of Z from -90 to +90°. Continue reading Is |Z| a really useful metric for optimising antenna systems?

VNA measurement – small is beautiful

I have written online and in many many emails that a very common failure of VNA measurements of components is the test fixture, and the standout problem is most often the length of connecting wires.

This article works a couple of theoretical designs based on a validated model and experience of building and measuring many baluns of similar or identical design. We will then look at extracts from a Youtube video by ferrite manufacturer Fair-rite and appraise the results.

Validated theoretical choke designs

FT240-43

It is possible to calculate a pretty good estimate of the impedance of a common mode choke wound on a #43 material ferrite core over 1-30MHz. Measurement of a real choke suggests an equivalent shunt capacitance to calibrate the model to measurement. Whilst I have given the generic name to this core, it is based on Fair-rite’s 5943003801 and Fair-rite’s published 2020 #43 mix characteristics. There are imposters, and they may be significantly different.

Let us take a practical example design and calculate the expected choke impedance and from that, the expected |s21|dB in a VNA series through measurement setup.

Above is a SimNEC model of a FT240-43 with 11t winding and 2.5pF equivalent shunt capacitance to calibrate the self resonant frequency. The model calculates and plots choke impedance, and |s21|dB in the series through measurement configuration shown. Continue reading VNA measurement – small is beautiful

VNA fixture for measuring Zcm of a common mode choke – twisted pair wound

VNA fixture for measuring Zcm of a common mode choke – coax wound discussed issues with common ham practice for measuring coax wound common mode chokes.

The article left readers with some homework:

  • Does the same thing occur if the core is wound with twisted pair that is well represented as a uniform two wire transmission line?
  • Are the resistors beneficial?
  • Do they degrade fixture behavior?
  • Then, why are the used so often?

This article addresses those questions.

Does the same thing occur if the core is wound with twisted pair that is well represented as a uniform two wire transmission line?

Let’s treat the common mode choke as a black box with two input terminals at left and two output terminals at right with voltages as annotated above. Continue reading VNA fixture for measuring Zcm of a common mode choke – twisted pair wound

VNA fixture for measuring Zcm of a common mode choke – coax wound

A common online question is what sort of fixture is appropriate to measure the common mode impedance of a common mode choke.

Above is a screenshot from a Youtube video by Trx Lab, probably about 2016 vintage. I see many problems with the fixture, lets start with the resistors. Continue reading VNA fixture for measuring Zcm of a common mode choke – coax wound

Does RBN give a reliable metric for comparing antennas – more detail

Does RBN give a reliable metric for comparing antennas? gave an example of signal strength measurement and the effect of fading over time.

This article goes into a little more depth on the subject using a further data capture of 600 measurements 10s apart.

Above is a plot of signal strength of an 80m A1 Morse (CW) beacon measured in 20Hz bandwidth over 100min (a terrestrial path of length 105km). Continue reading Does RBN give a reliable metric for comparing antennas – more detail

Reconciliation of transmitter power, EIRP, received signal strength, antenna factor, ground wave propagation etc @ 576kHz

This article reconciles measurements with path predictions for a MW AM transmitter on 576kHz. The techniques used could be used to validate / assess the performance of a transmitter.

Source

The source is a MF AM transmitter on 576kHz located about 74km distant.

Above is the station data from the ACMA licence register. Conveniently it gives the EIRP as 132kW, we would expect something a little less than 150kW from the nominal 50kW transmitter, system efficiency calculates to 80%.

The EIRP would have been calculated from a set of field strength measurements at the time of commissioning. Continue reading Reconciliation of transmitter power, EIRP, received signal strength, antenna factor, ground wave propagation etc @ 576kHz

Does RBN give a reliable metric for comparing antennas?

I see that lots of hams depend on HF RBN to compare to antennas, or to compare before and after a change.

Experience says that A/B comparisons on HF are subject to variation in Ionospheric propagation paths, and that variation can be wide in range and rapid.

An example

Above is a plot of signal strength of an 80m A1 Morse (CW) beacon measured in 20Hz bandwidth over 15min snapshot (a terrestrial path of length 105km). Continue reading Does RBN give a reliable metric for comparing antennas?

NanoVNA setup for shunt matching task – scripting the setup

NanoVNA setup for common antenna system measurement tasks showed a display configuration better suited to those tasks.

It is tedious to set the display up using the device menu, and setups may vary with different NanoVNA hardware and firmware.

The firmware I used was NanoVNA.H.v1.2.20 which allows some setup using serial port commands. This article describes the technique.

The command used is the trace command

trace {0|1|2|3|all} [logmag|phase|delay|smith|polar|linear|swr|real|imag|r|x|z|zp|g|b|y|rp|xp|sc|sl|pc|pl|q|rser|xser|zser|rsh|xsh|zsh|q21] [src]
trace {0|1|2|3} [lin|log|ri|rx|rlc|gb|glc|rpxp|rplc|rxsh|rxser]
trace {0|1|2|3} {scale|refpos} {value}

For this exercise, I used Teraterm5 which allows setting delays after each character and after each line so that the NanoVNA is not overrun.

Above, the Teraterm serial port setup. Continue reading NanoVNA setup for shunt matching task – scripting the setup

NanoVNA setup for shunt match tasks

NanoVNA setup for common antenna system measurement tasks offered an example NanoVNA configuration well suited to the most common antenna system tuning / adjustment tasks.

This article looks at a different case, a configuration to support measurement, design, and implementation / tuning of a shunt match.

A shunt match scheme is one where the antenna with low feed point R at resonance is detuned to add some capacitive or inductive reactance, which is then offset with a shunt reactive element of the opposite sign, for the outcome of a load impedance of 50j0Ω.

VNA Calibration

The VNA is OSL calibrated at its Port 1 jack.

Measurements in this example will be made through a 50Ω coax tail of about 1m, so we need to adjust the reference plane to the feed point. In this example, the native reference plane is the NanoVNA jack, and e-delay is used to approximately offset the reference plane. It is a good approximation in this case.

You could instead calibrate the fixture to include the coax tail, but you will need appropriate cal parts… and if they are poor, the previous method may be more accurate.

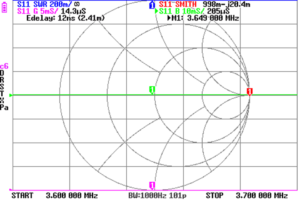
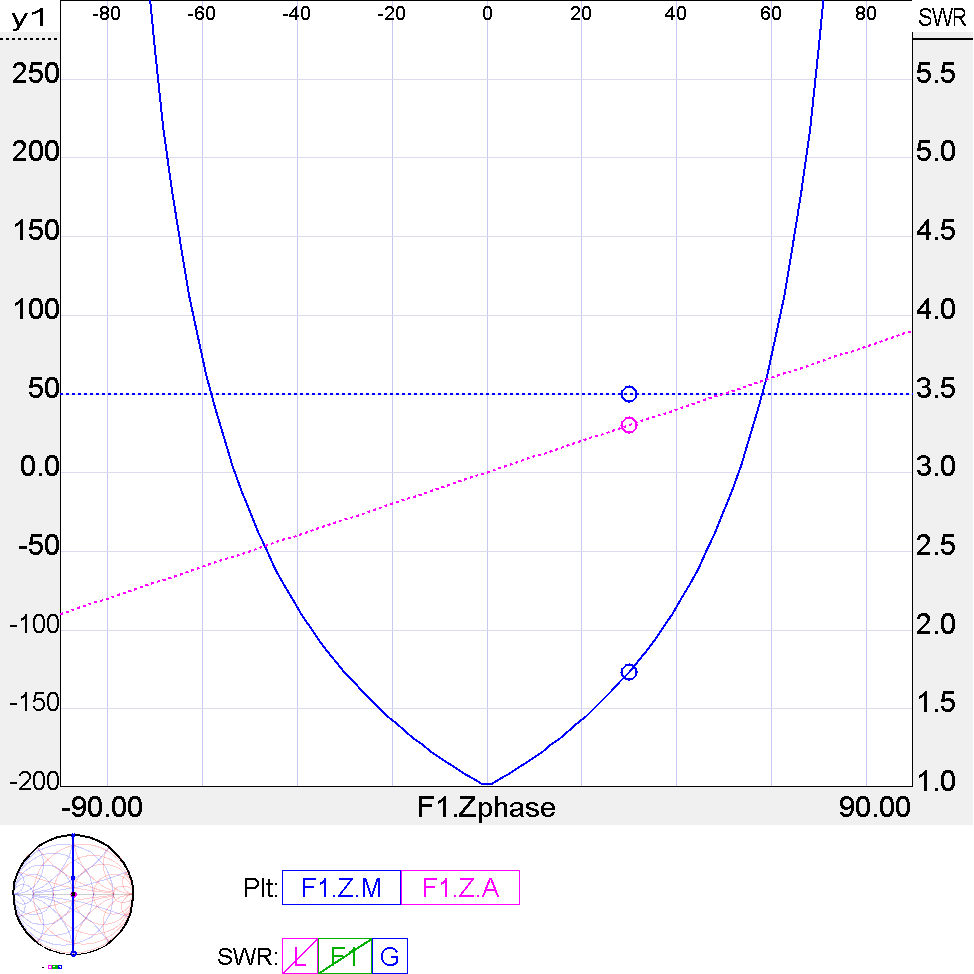
Above, a measurement is made of the coax tail with an open circuit (OC) at the far end, and e-delay iteratively adjusted so that the Smith chart plot is a dot at R=infinity+j0, the right hand end of the Z=0 axis above. Continue reading NanoVNA setup for shunt match tasks

s11 and phase wrapping

Fazed by s11 phase magic? mentioned the effect of phase wrapping on s11 phase plots, and the apparent discontinuity that is actually an artifact of the wrapping process.

Phase wrapping is the presentation of phase values to always appear in the range typically -180° to 180° (or sometimes 0° to 360°).

F1AMM published an example .s1p file of an antenna system measurement. Let’s use that as a real world example to demonstrate the effect of phase wrapping.

Above is a Smith chart presentation of the data. You might interpret the curve near the marker to show a sudden flip from -ve phase to +ve phase… but is phase discontinuous? Continue reading s11 and phase wrapping