Fazed by s11 phase magic? mentioned the effect of phase wrapping on s11 phase plots, and the apparent discontinuity that is actually an artifact of the wrapping process.
Phase wrapping is the presentation of phase values to always appear in the range typically -180° to 180° (or sometimes 0° to 360°).
F1AMM published an example .s1p file of an antenna system measurement. Let’s use that as a real world example to demonstrate the effect of phase wrapping.
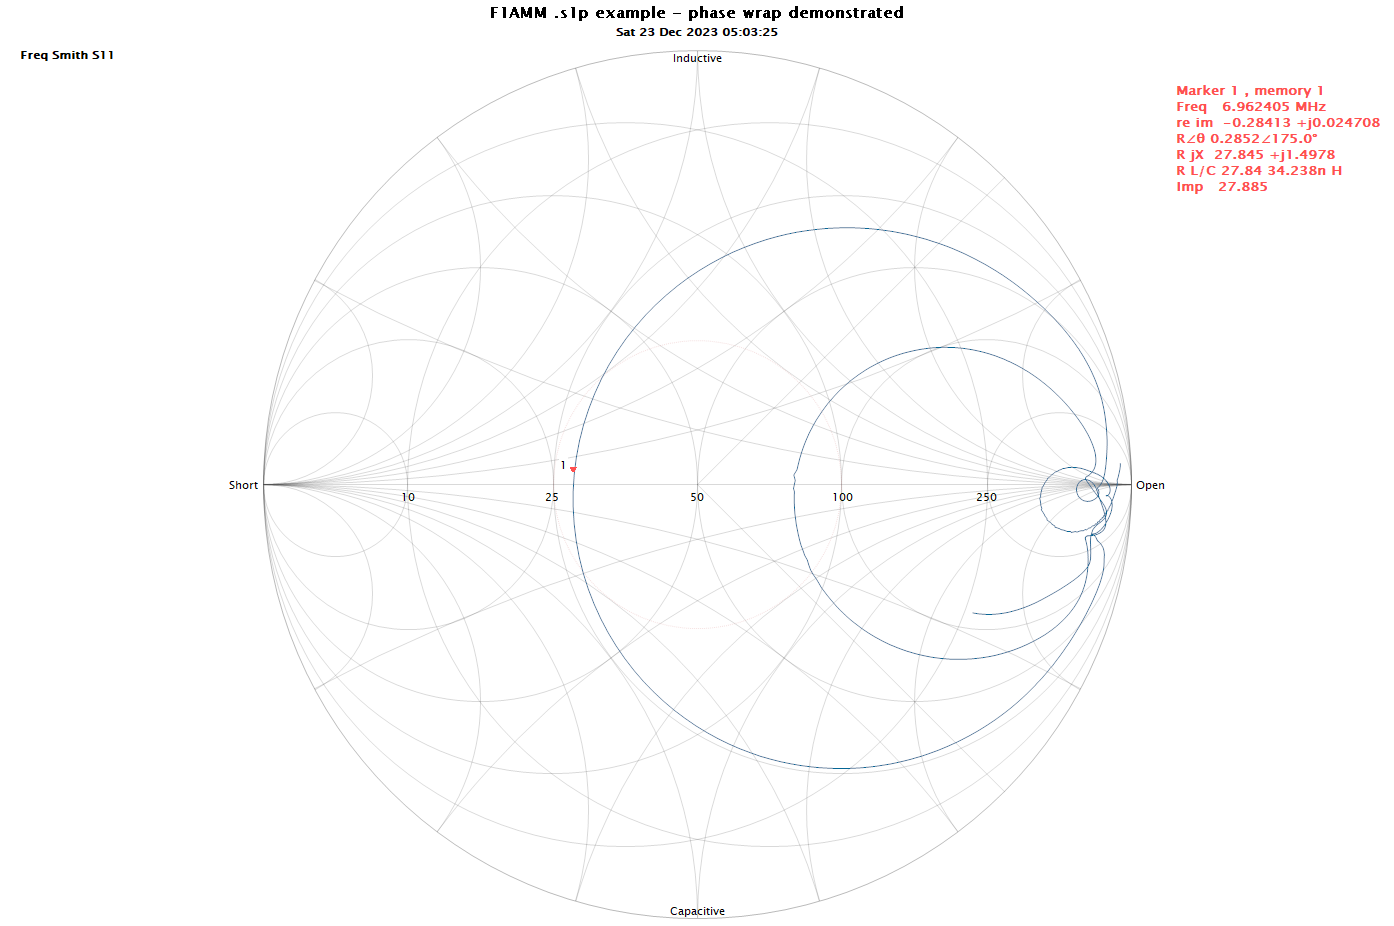
Above is a Smith chart presentation of the data. You might interpret the curve near the marker to show a sudden flip from -ve phase to +ve phase… but is phase discontinuous?
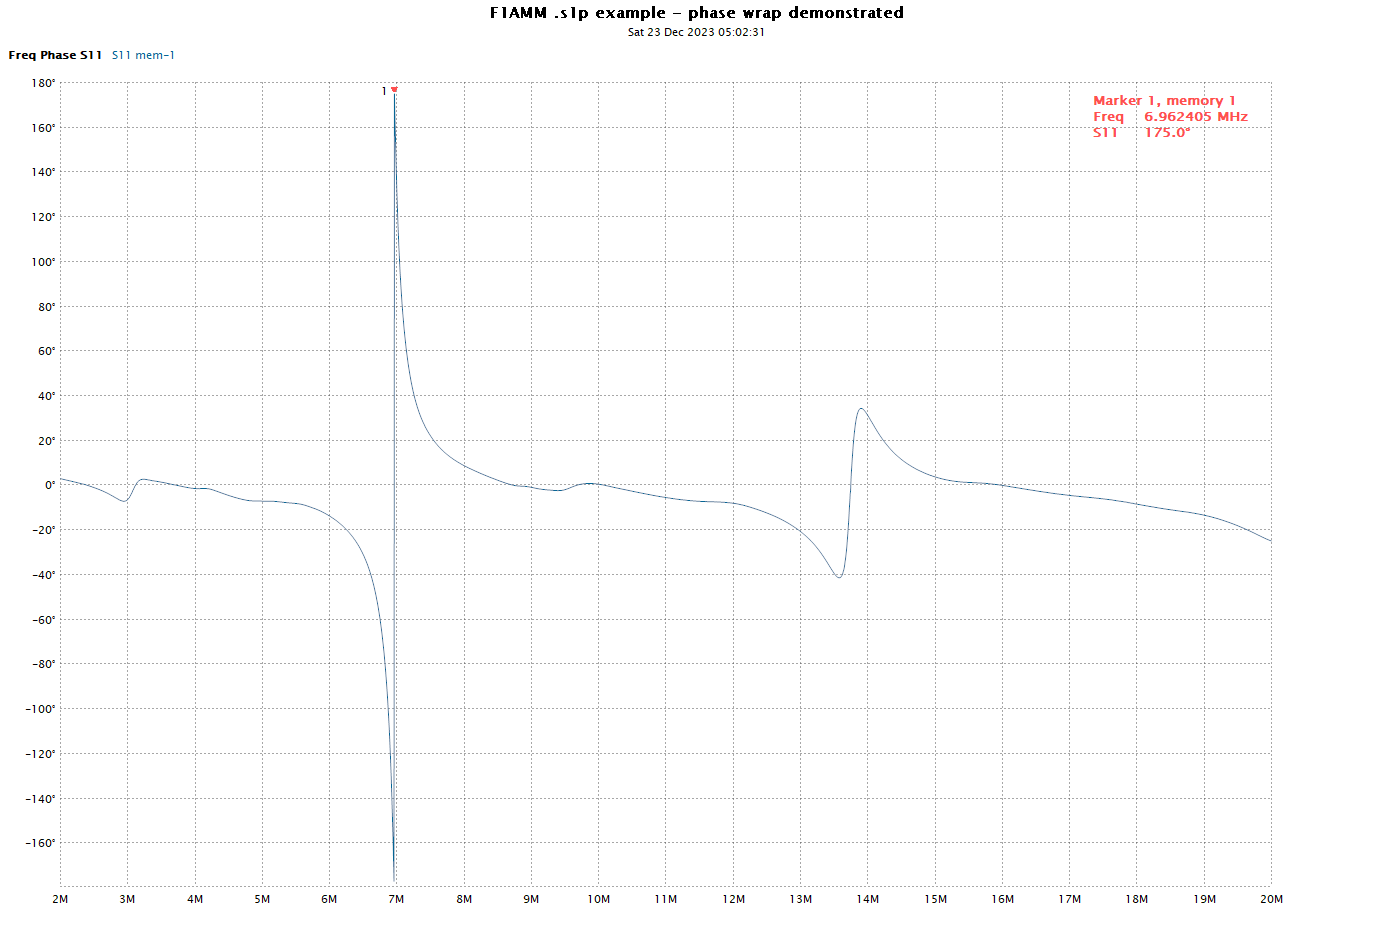
Above is a plot of phase of s11, it is the angle of the phasor from the centre of the Smith chart to the point on the curve on the Smith chart. It does look like there is a discontinuity near the marker.
It serves well to understand the underlying phenomena. There is a delay between the forward and reverse waves that are used to calculate s11. Now the circuitry of the directional coupler in the VNA would not usually measure delay, but measure phase, and there is a gap in its data capture because you cannot infer (absolute) delay from phase.
If we measure at a sufficiently low frequency, we can assume that the phase value measured has not wrapped, that UnWrappedPhase=Phase. Sweeping from a sufficiently low frequency allows us to reconstruct UnWrappedPhase.
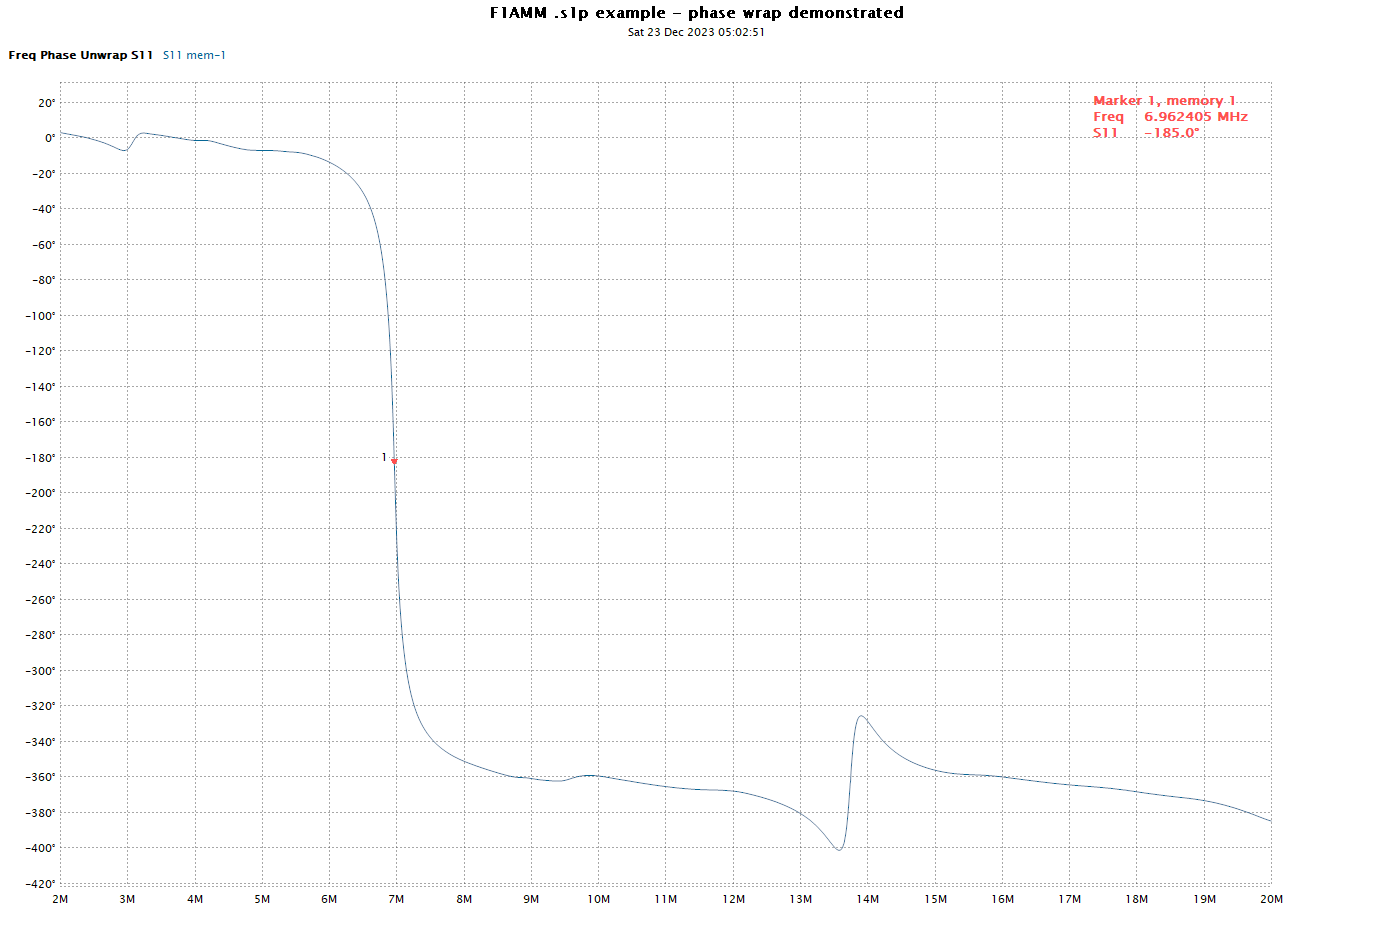
Above is an UnWrappedPhase plot derived from the example file, though we do not know if it has already wrapped at the left hand side (ie there may be an offset of n x 360° where n is unknown).
Nevertheless, for the purpose of this discussion we can explore the underlying phase response at that transition near the marker. Observe that UnWrappedPhase changes rapidly in that region, but the response is not discontinuous.
The apparent discontinuity in the phase plot is due to the wrapping process of the phase detector in the VNA’s directional coupler.
Now the important thing is that in the region of the marker, s11 did smoothly pass across the horizontal axis of the Smith chart, and even if there was not a measurement point exactly where it crossed, we can reasonably interpolate that the angle of s11 at that point was 180°.
It is wrong the interpret the phase plot and assert that phase at that point passed through 0°. The near vertical line in that region is a graphical flaw where two adjacent data points (near -180° and 180°) are interpolated with a straight line. The reader needs to exercise some sophistication in interpretation of all graphs where a set of discrete measurement points are joined by lines.
A more honest presentation of wrapped phase
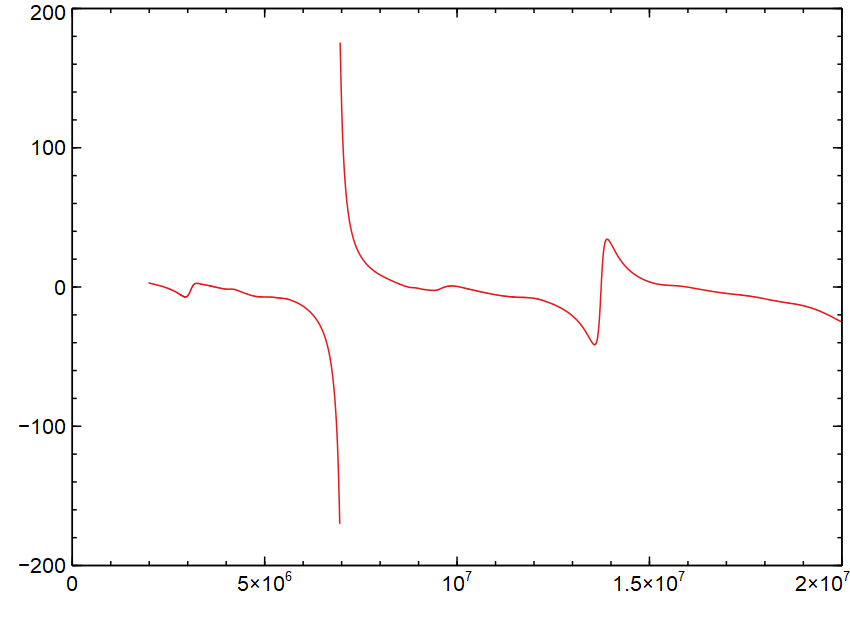
Above is an example of a graph of discrete data points (the phase data from the example), but interpolation between points is prevented at the phase wrap point so that the graph does not falsely show the vertical line at the wrap.