Signal to Noise Degradation, SND is a measure the extent of how the off-air or ultimate S/N ratio is degraded by a receive system.
We can calculate \(SND=10 \log (1+\frac{T_{sys}}{T_{amb}})\) where:
- Tsys is the equivalent system noise temperature at the space interface; and
- Tamb is the equivalent ambient noise temperature at the space interface.
For more explanation of the metric Signal to Noise Degradation (SND), see Signal to noise degradation (SND) concept.
The Noise Figure (NF) of a system or system component is often defined as the extent of how the system (or component) degrades S/N. The unstated assumption is that the source has an equivalent noise temperature of 290K.
We can calculate system \(NF=10 \log (1+\frac{T_{sys}}{T_{0}})\) where:
- Tsys is the equivalent system noise temperature at the system interface; and
- T0 is the assumed reference temperature, 290K.
System NF can be thought of as a measure of system degradation of S/N for a specific source noise temperature of 290K.
The two expressions above might be similar in form, but are different and give very different results.
NF does not bring to book the external or ambient noise as it applies to a specific scenario, so it does not provide a complete picture of S/N degradation.
Studies using SND
Complex shipboard receive system

The graph above is the summation of a model of a shipboard communications system with a cascade of components (active antenna, transmission line, matrix switch, distribution amplifier and receiver) to calculate an equivalent system noise temperature Tint, the expected median ambient noise using ITU-R P.372, and calculated SND.
In this case, Tint is fairly independent of frequency, not quite, but fairly (as is often the case), Tamb is quite frequency dependent, and so SND varies with frequency. SND might seem high, but this is a naval vessel, not an antenna farm.
Active dipole using AAA-1C amplifier
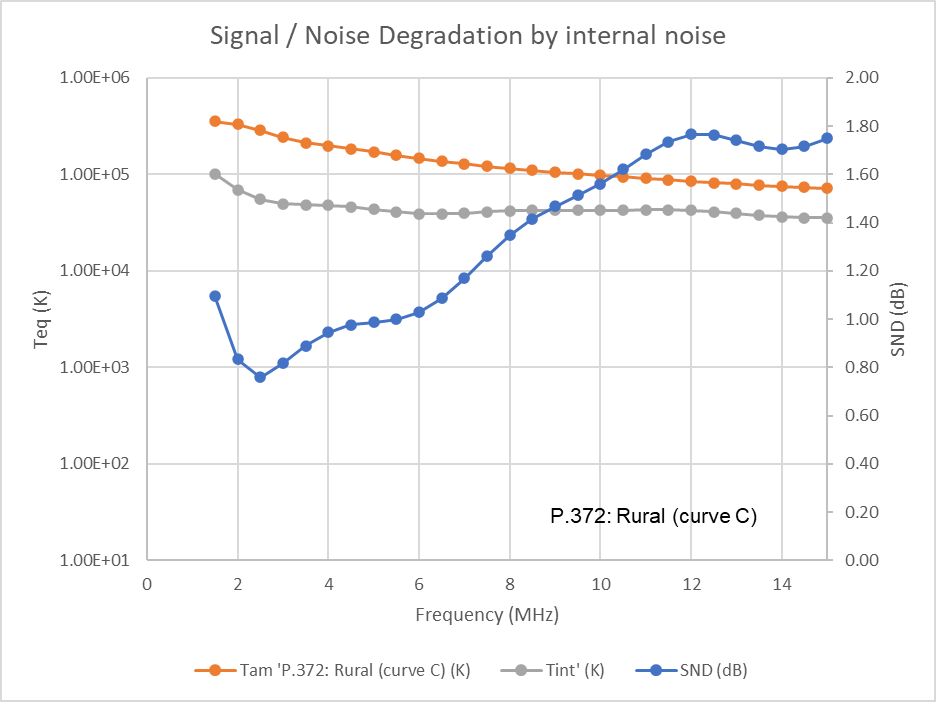
The graph above is the summation of a model of a simple communications system with a cascade of components (active antenna, transmission line, and receiver) to calculate an equivalent system noise temperature Tint, the expected median ambient noise using ITU-R P.372, and calculated SND.
In this case, Tint and Tamb are quite frequency dependent, and SND varies with frequency. SND is relatively low over the frequency range plotted..