 I have had cause to validate the output produced by an AIMuhf measurement using AIM882 (current version, released about three months ago).
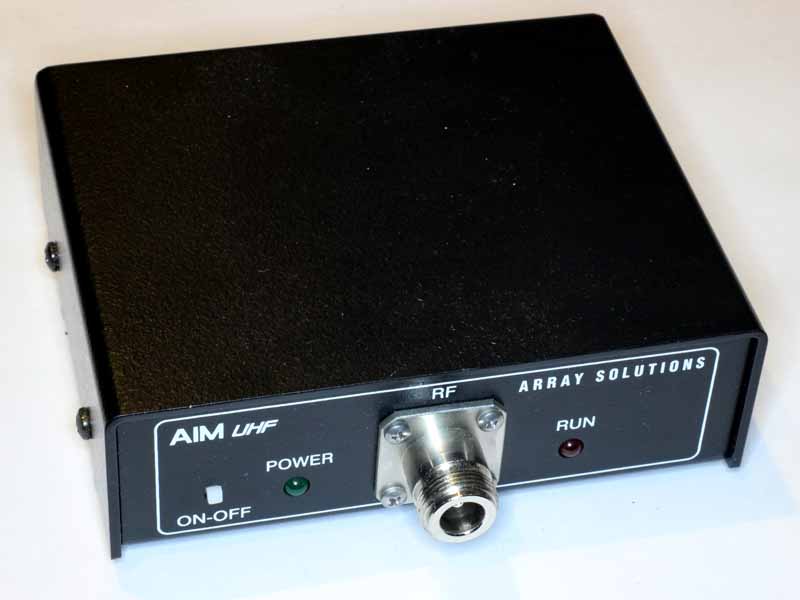
The test scenario is a pair of nominal 50+j0Ω loads on a Tee piece, connected to the AIMuhf by about 1m of RG58 coax and swept from 10 to 50MHz.
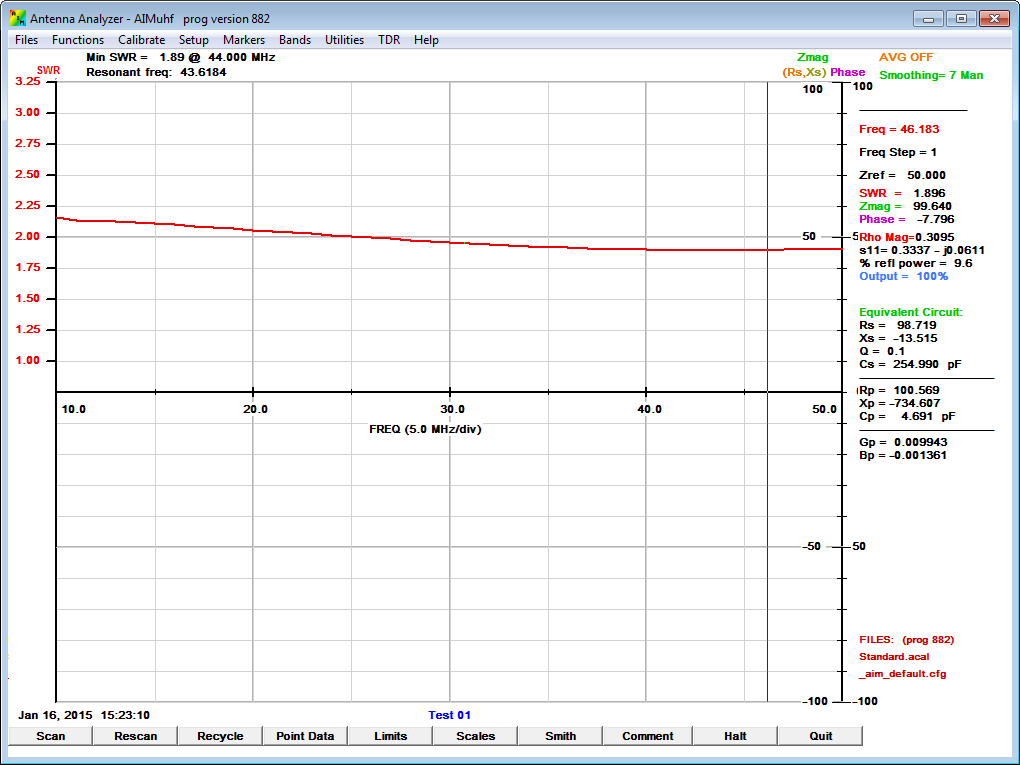
It is mental arithmetic that the VSWR should be very close to 2:1, and since the loss of the cable is quite low, VSWR should be almost uniform with frequency. Continue reading AIM 882 produces internally inconsistent results