Over time, readers of The sign of reactance have suggested that determining the sign of reactance with an antenna analyser that does not directly measure the sign is not all that difficult, even for beginners. The article shoots down some of the most common algorithms as failures on simple cases.
This article gives measurements made from a simple network of two identical lengths of 50Ω coax, a 50Ω resistor and a 4.7Ω resistor. It is a network designed to offer a challenge to the simple algorithms, and it IS solvable analytically… but not with most algorithms and software,
Here is the data from measurement made with an AA-600 and then all – signs removed, so in fact the Xs column is |Xs|.
"Zplots file generated by AntScope"
"Freq(MHz)","Rs","Xs"
9.000000,78.13,53.66
9.250000,82.12,51.10
9.500000,86.10,47.83
9.750000,89.46,44.00
10.000000,92.30,39.90
10.250000,94.53,35.39
10.500000,96.21,30.71
10.750000,97.17,26.14
11.000000,97.49,21.54
11.250000,97.30,17.12
11.500000,96.54,13.04
11.750000,95.47,9.14
12.000000,93.92,5.68
12.250000,92.16,2.70
12.500000,90.25,0.17
12.750000,88.13,2.50
13.000000,85.94,4.50
13.250000,83.67,6.15
13.500000,81.45,7.36
13.750000,79.29,8.38
14.000000,77.22,9.21
14.250000,75.21,9.78
14.500000,73.23,10.16
14.750000,71.44,10.37
15.000000,69.70,10.25
15.250000,67.99,10.23
15.500000,66.50,9.99
15.750000,65.10,9.68
16.000000,63.81,9.27
16.250000,62.65,8.72
16.500000,61.59,8.15
16.750000,60.55,7.54
17.000000,59.69,6.86
17.250000,58.97,6.20
17.500000,58.20,5.43
17.750000,57.66,4.68
18.000000,57.14,3.81
18.250000,56.77,2.98
18.500000,56.47,2.16
18.750000,56.22,1.22
19.000000,56.04,0.38
19.250000,56.07,0.50
19.500000,56.02,1.38
19.750000,56.12,2.29
20.000000,56.41,3.15
20.250000,56.68,4.03
20.500000,57.11,4.86
20.750000,57.51,5.72
21.000000,58.06,6.61
21.250000,58.77,7.45
21.500000,59.54,8.22
21.750000,60.47,8.95
22.000000,61.44,9.75
22.250000,62.52,10.34
22.500000,63.77,10.97
22.750000,65.11,11.55
23.000000,66.56,12.02
23.250000,68.11,12.38
23.500000,69.82,12.64
23.750000,71.75,12.82
24.000000,73.67,12.84
24.250000,75.96,12.67
24.500000,78.12,12.27
24.750000,80.40,11.72
25.000000,83.05,10.69
25.250000,85.56,9.68
25.500000,88.29,8.09
25.750000,90.92,6.21
26.000000,93.63,3.91
26.250000,96.17,1.13
26.500000,98.61,2.16
26.750000,100.68,5.92
27.000000,102.51,10.11
27.250000,103.87,14.90
27.500000,104.65,19.98
27.750000,104.71,25.32
28.000000,103.98,30.95
28.250000,102.58,36.48
28.500000,100.14,41.97
28.750000,97.08,47.32
29.000000,93.07,51.86
Imported and rendered graphically in ZPlots we have:
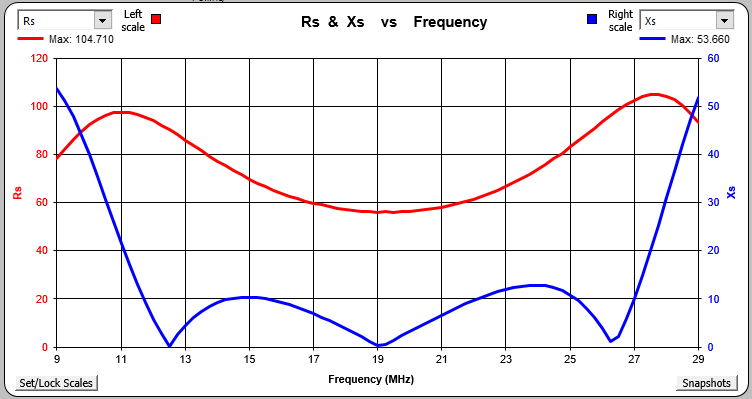
The challenge is what is the sign of X across the frequency range?
Whilst the sheer volume of data might seem to make the problem more difficult, it actually increases the chances of correct information… sparse data makes solving this problem more difficult.
Try to write down an algorithm that works reliably when applied to each of the data points (though you will need to consider neighbours).
I will post a follow-up article with the signed data plotted.