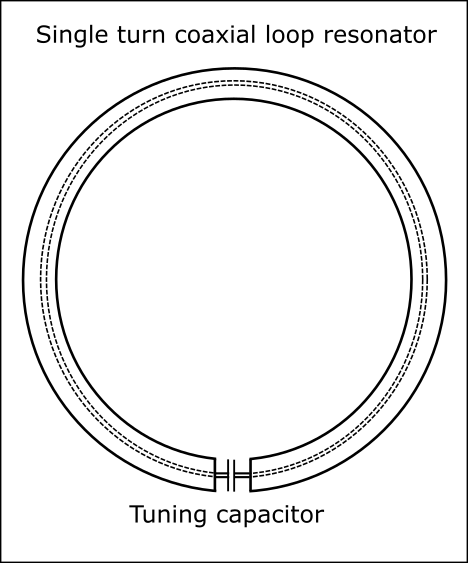
(Findling, A & Siwiak 2012) documented measurements they made of a popular small transmitting loop (STL), an Alexloop Walkham.
Now Alexloops seem to have undergone some evolution, and there does not seem to be a clear list of model names or numbers with features or specifications, so to some extent the antenna is a little non descript.
The article did not document the environment of the test antenna, but Findling explained in correspondence that it was relatively clear of conducting structures and about 1.2m above natural ground.
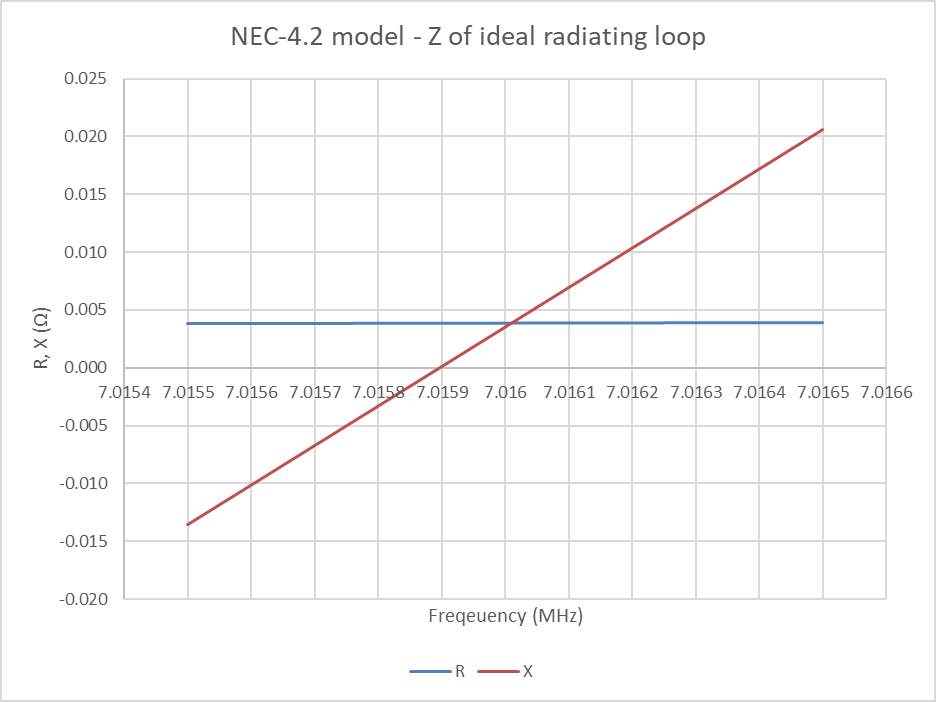
A NEC-4.2 model of the antenna at 7MHz was built and calibrated to their measured half power bandwidth (19kHz). Model assumptions include:
- ‘average’ ground (σ=0.005, εr=13);
- Q of the tuning capacitor = 1000;
- conductivity of the loop conductor adjusted to calibrate the model half power bandwidth to measurement.
Note that the model may depart from the actual test scenario in other ways, it is challenging to glean all the data that one would like from the article.

Above is an extract from (Findling, A & Siwiak 2012).

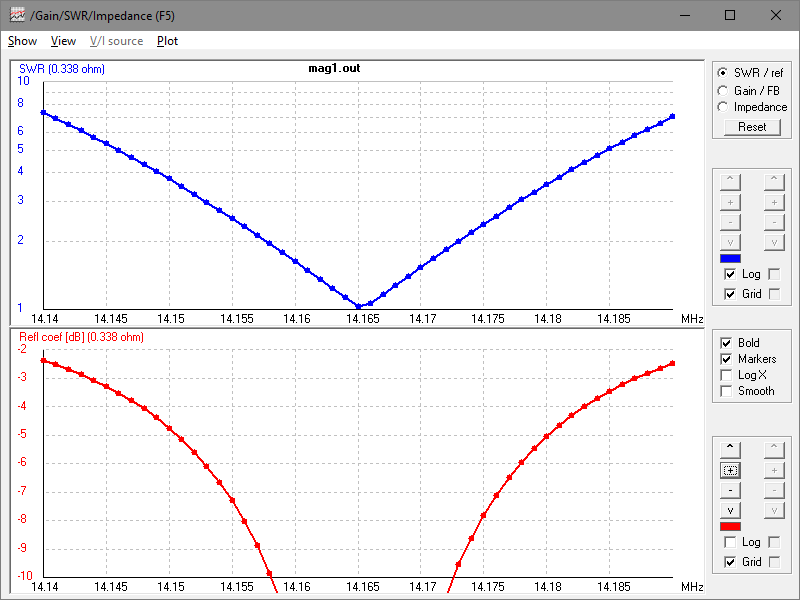
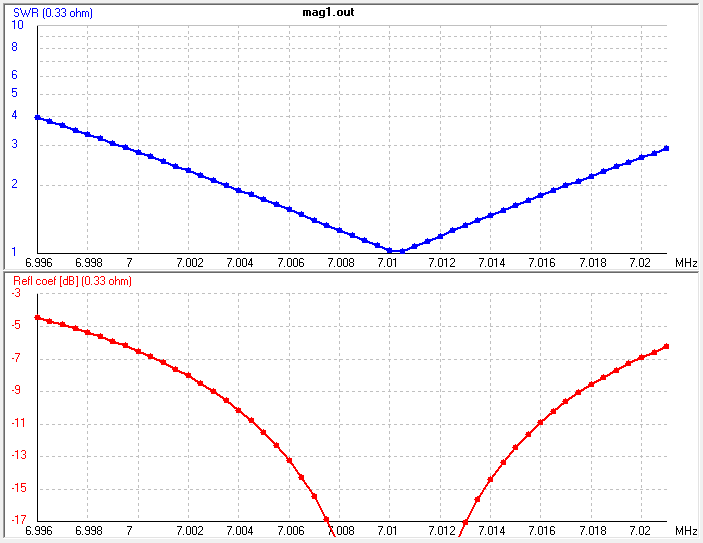
Above is the VSWR scan of the calibrated model, the load is matched at centre frequency and half power bandwidth is taken as the range between ReturnLoss=6.99dB points. Continue reading Findling & Siwiak 2012 measurements of an Alexloop
Last update: 13th September, 2018, 8:41 PM