In this article, I will outline an evaluation of a ‘classic’ voltage balun, the 1:1 RAK BL-50A voltage balun, specified for 1.8-30MHz.
These were very popular at one time, but good voltage baluns achieve good current balance ONLY on very symmetric loads and so are not well suited to most wire antennas.
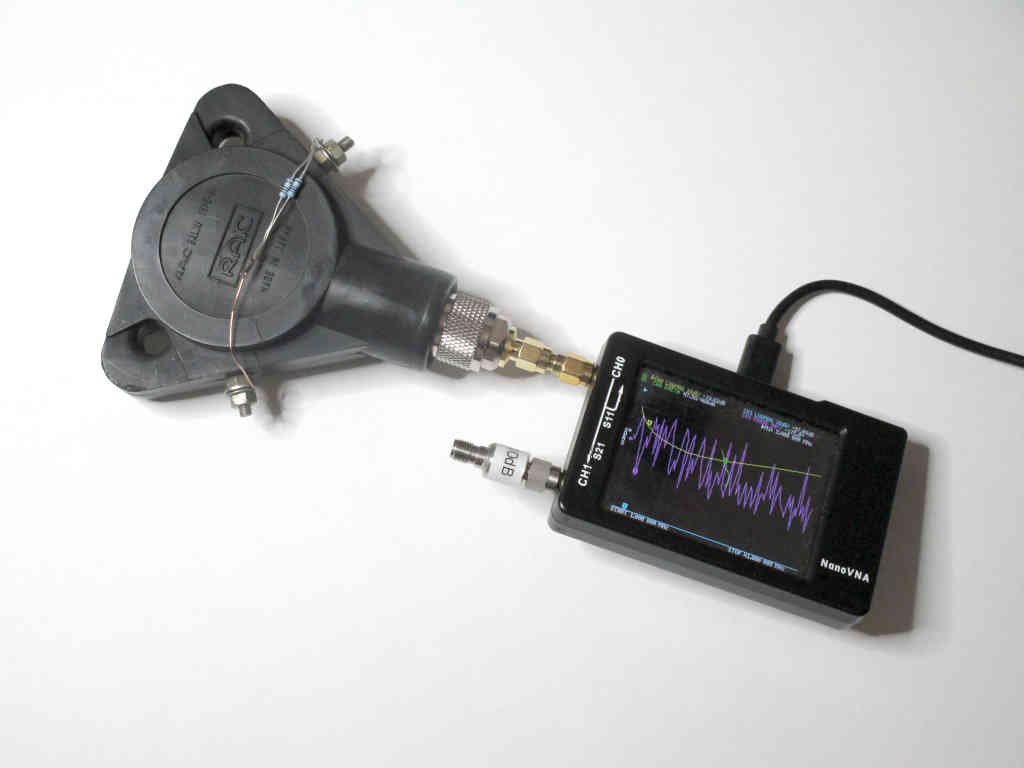
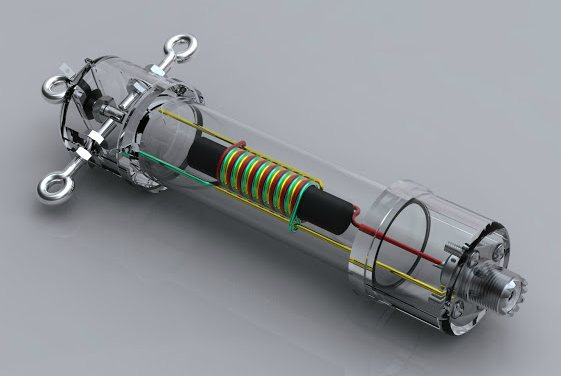
Above is a pic of the balun with load on test. It is not the greatest test fixture, but good enough to evaluate this balun over HF.
Mine has survived, but many users report the moulding cracking and rusted / loose terminal screws, and signs of internal cracks in the ferrite ring.
Continue reading nanoVNA – evaluation of a voltage balun – RAK BL-50A