Precision GPS experiment #1

This article reports an experiment to evaluate the usefulness of precision GPS for the purpose of location data for automated antenna field strength surveys.

The experiment was conducted with the rover located in a fixed location 13km North of the reference station at Symonston and with very wide view of the sky, about 7:00 am 07/04/2016.

Only GPS satellites were used for the rover.

The software was RTKLIB v2.4.3b8.

IMG_0505

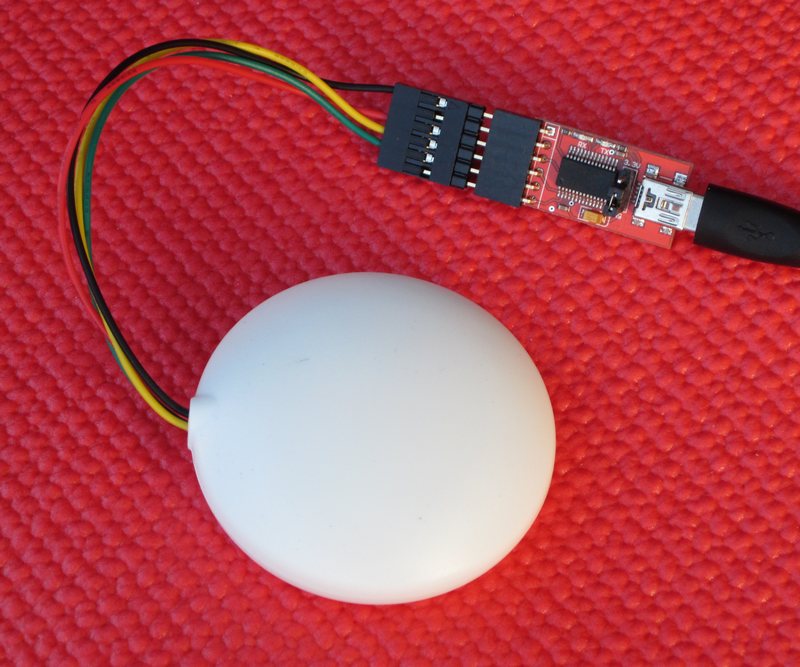
The GPS was a UBLOX LEA-6T with a small patch antenna (as sold for small UAVs). The LEA-6T provides binary data as used by RTK for carrier phase measurements. Above is the GPS and a USB-RS232 adapter. Continue reading Precision GPS experiment #1

Ultrafire XML-T6 LED torch – a fix for the dysfunctional mode memory ‘feature’

On review of the Ultrafire XML-T6 torch, I found the mode switching / mode memory so dysfunctional that it rendered the torch useless in my evaluation.

XML-T6This article describes a work around  that makes the thing usable (IMHO). Continue reading Ultrafire XML-T6 LED torch – a fix for the dysfunctional mode memory ‘feature’

Chinese 18650 Li-ion cells – Ultrafire capacity test

I purchased a torch (flashlight) on eBay recently. It was described as using CREE T6 LED array, and supplied with two 4200mAh 18650 Li-ion rechargeable batteries with charger for A$25 inc post.

Ultrafire18650Above, the cells are clearly marked 3000mAh, way short of the advertised 4200mAh… but what is their actual capacity.

Screenshot - 04_03_16 , 19_45_49

Above are the results of discharge tests, the first digit is the cell number and the second is the test. The first test is charged with the supplied charger, the second test is with my charger. Continue reading Chinese 18650 Li-ion cells – Ultrafire capacity test

Measuring common mode choke Zcm using a two port VNA

There are some who insist that it is not possible to make practical measurements of a common mode choke using a one port analyser, and recommend the ‘S21 method’

S21 method

The ‘S21 method’ means different things to different people.

Screenshot - 20_02_16 , 14_31_07
Figure 1.

Above, (Agilent 2009) describe the common methods of impedance measurement using a VNA. The first method is often supported with direct display of R,X, and possibly a Smith chart presentation of Γ. Continue reading Measuring common mode choke Zcm using a two port VNA

Updated: Calculate initial load line of valve RF amplifier

Calculate initial load line of valve RF amplifier was written as a companion to my RF power amplifier tube performance computer tool to provide a starting point for building a model, but as it turns out, the initial load line (and related values) is a very good estimate and further modelling may not be needed.

Although written for an application to valves, it is quite applicable to any active device, keeping in mind that it assumes a linear transfer characteristic.

The update provides for both single ended and push-pull configurations.

For example, the requirement is for a single ended Class C bipolar amplifier to deliver 25W from a 13.8V DC supply. What is the ratio for a broadband output transformer to 50Ω.

Screenshot - 13_02_16 , 08_51_22

Above is the solution. The required Rl is 3.3Ω, and the required turns ratio is (50/3.3)^0.5=3.9. a 1:4 (turns) transformer would be selected for a prototype. Bear in mind that output power would fall to around 20W at 12V DC supply.

Another example is the common 100W 13.8V Class B push-pull design.

Screenshot - 13_02_16 , 09_22_26

With a requirement for around 3Ω collector to collector (or drain to drain), a transformer with 1:4 turns ratio would be selected.

Identifying ferrite materials #2

A correspondent wrote about Identifying ferrite materials asking how to use the method on an analyser that does not display X, but displays R and |Z|.

The method described calls for making a winding of the least number of turns for which measurement can reasonably be made, and finding the lowest frequency where R=X.

If your analyser does not display X (or |X|), you can exploit the relationship that |Z|=(R^2+X^2)^0.5. When R=X, |Z|=1.414R… so you would look for the lowest frequency where |Z|=1.414R.

Having found that, compare it with the table given or datasheet graphs to find candidate mixes.

Reconciling my #52 choke design tool with G3TXQ’s measurements

A correspondent wrote with concern of the apparent difference between graphs produced by my #52 choke design tool with a graph published by G3TXQ of his measurement of 11t on a pair of stacked FT240-52 cores.

I published a note earlier about my concerns with a similar graph by G3TXQ compared to the Fairrite datasheet, and he reviewed the data, found the error and published a corrected graph.

FT240-52x2-11t

The corrected graph above might at first glance appear different to my model’s graphs, and the first obvious difference is that G3TXQ uses a log Y scale (which is less common). The effect of the log scale is to compress the variation and give the illusion perhaps that in comparison with other plots, this balun has a broader response.

Screenshot - 09_02_16 , 18_29_42

To compare the two, I have roughly digitised G3TXQ’s graph above and plotted the data over that from my own model (with linear Y scale). Continue reading Reconciling my #52 choke design tool with G3TXQ’s measurements

Identifying ferrite materials

This Jan 2012 article has been copied from my VK1OD.net web site which is no longer online. It is for reference from other related articles. The article may contain links to articles on that site and which are no longer available.

One often wants to identify the type of material used in a ferrite core for use at radio frequencies. This article captures advice that the author has offered in online fora stretching back more than a decade, yet it seems uncommon knowledge.

The most common method is to make some measurements to determine the initial permeability µi, usually at audio frequencies, and to compare that to a table of µi for common core materials. This method might well indicate several mixes that have similar µi, but each may be quite different at higher frequencies.

The suitability for use at RF usually depends much more on complex permeability at radio frequencies than it does on µi at say 10kHz.

cf01Above is a plot from the Fair-rite data book showing the complex permeability characteristic of #43 ferrite material. Continue reading Identifying ferrite materials