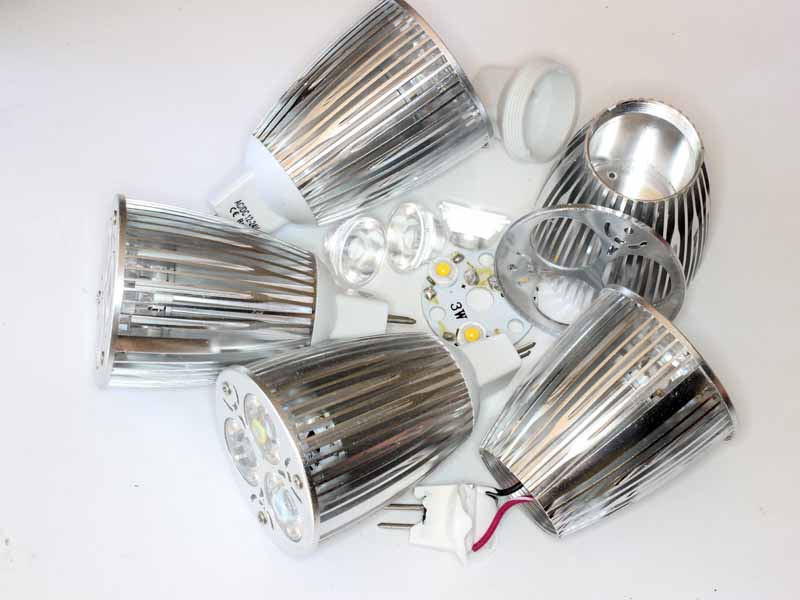
I have a project which needs some mid power (~3W) white wide angle (120+°) LEDs.
The obvious source ie eBay which means running the gamut of Chinese sellers, sellers who rarely understand the product they sell and probably expect the same of buyers.
Buying electronic components on eBay
Component sales tend to fall into categories:
- those with headline descriptions that have very brief description of characteristics; and
- those whose descriptive content claims well known part numbers for which datasheets can separately be found;
- those with detailed specifications offered.
In the case of category 1, it is very hard to have confidence that the components will deliver required performance, and headline descriptions on eBay are often used as competitive search keywords and do not apply to the goods on offer. These are probably best skipped unless they are the only option.
Category 2 provides a better option, and the question then on delivery is whether the goods are compliant with the part number offered. There is a considerable risk of counterfeit or fake parts that are not equivalent to the claimed part number, even where brand names are cited.
The third category can provide suitable product, but it takes some leg work, more than ‘due diligence’ to check the description for consistency and form an idea about its reliability, fit to the requirements and then value for money, seller reputation etc. This can be a lot of work for a few dollars worth of parts, but is a better option than category 1. Continue reading A search for some mid power white wide angle LEDs
Last update: 26th May, 2017, 5:32 PM