Failure estimating transmission line Zo – λ/8 method – nanoVNA discussed the potential for failure using this ‘no-brainer’ method of estimating differential mode characteristic impedance Zo, providing an NEC-4.2 model to demonstrate effects.
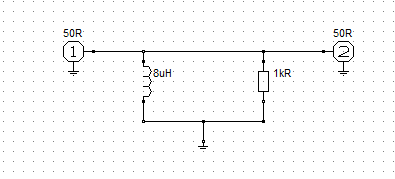
This article reports nanoVNA measurement of a two wire line where no common mode countermeasures were taken.
A little review of behavior of practical transmission lines
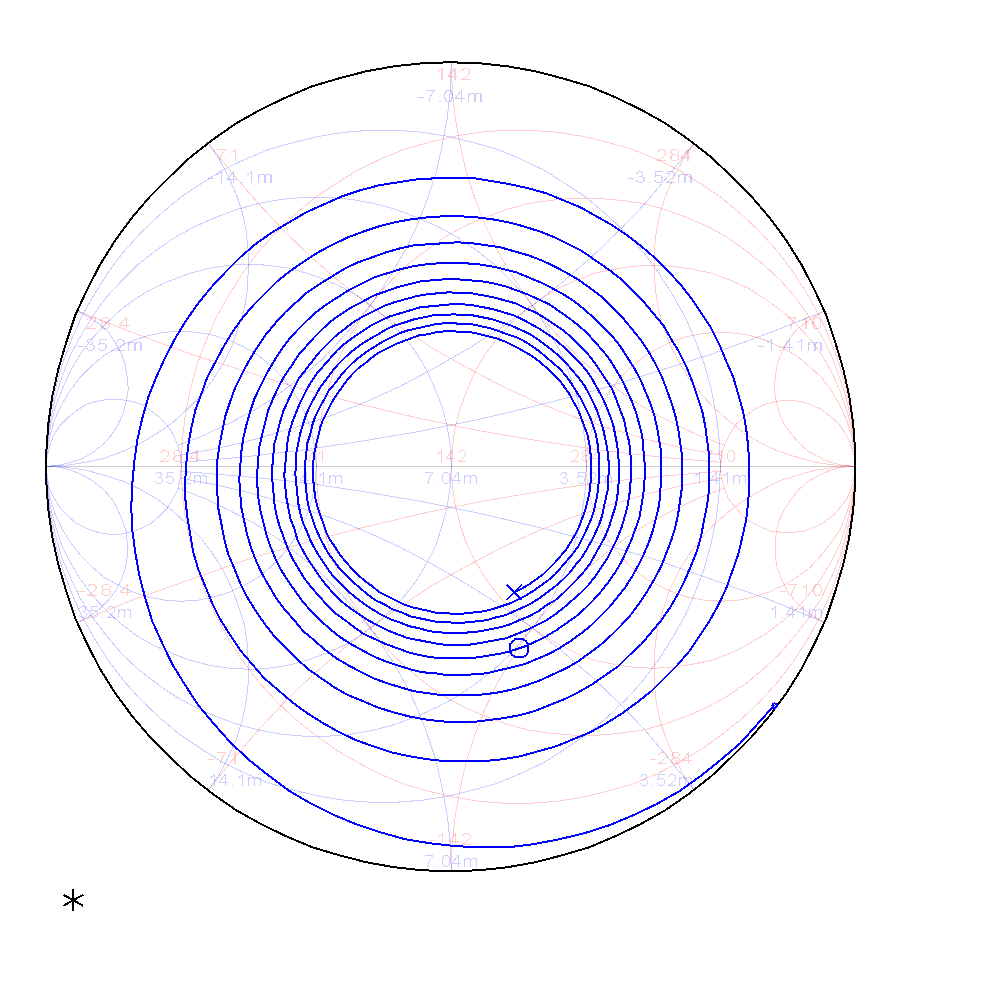
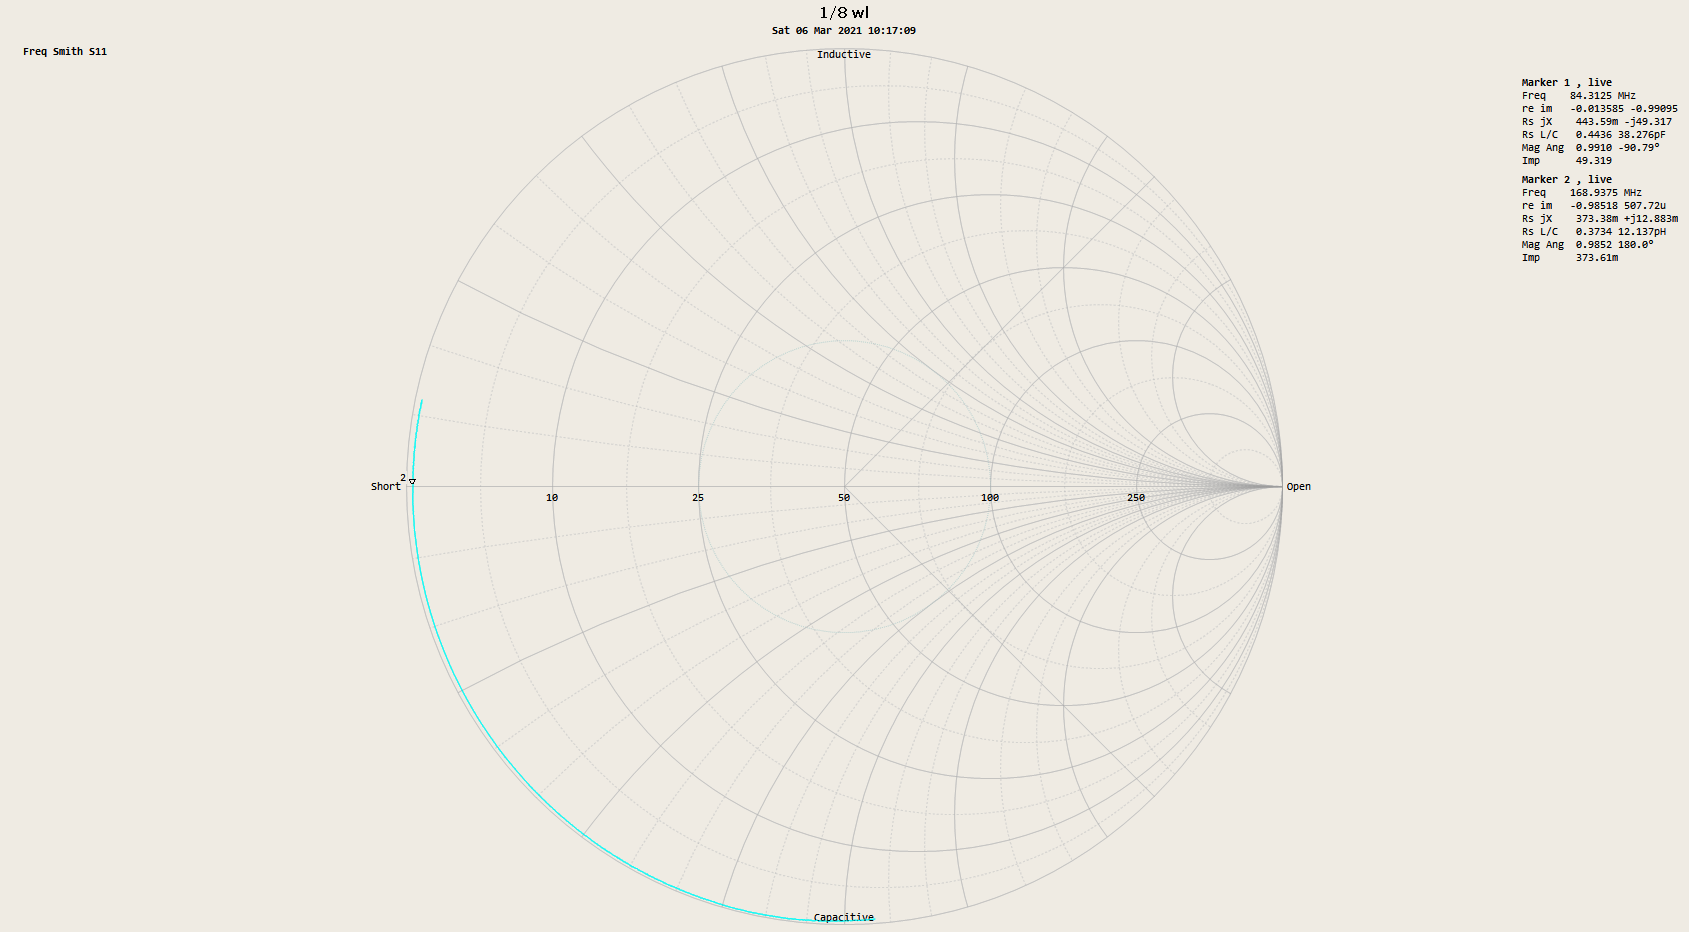
Above is a Smith chart of the complex reflection coefficient Γ (s11) looking into a length of nominally 142Ω transmission line of similar type to that in the reference article, the chart is normalised to Zref=142+j0Ω. Note the locus is a spiral, clockwise with increasing frequency, and centred on the chart prime centre Zref. More correctly it is centred on transmission line Zo, and the keen observer might note that the spirals are offset very slightly downwards, actual Zo is not exactly 142Ω, but 142-jXΩ where X is small and frequency dependent, a property of practical lines with loss. Continue reading Measuring OC and SC transmission line sections