Design / build project: Guanella 1:1 ‘tuner balun for HF’ – #7

Seventh part in the series documenting the design and build of a Guanella 1:1 (current) balun for use on HF with wire antennas and an ATU.

  • This article describes a measurment of common mode impedance Zcm of the packaged balun.

Packaging

The prototype fits in a range of standard electrical boxes. The one featured here has a gasket seal (a PTFE membrane vent was added later).

AtuBalun201

Above, the exterior of the package with M4 brass screw terminals each side for the open wire feed line, and an N(F) connector for the coax connection. N type is chosen as it is waterproof when mated. Continue reading Design / build project: Guanella 1:1 ‘tuner balun for HF’ – #7

Where is the best place to measure feed point VSWR – error in Zo

At Where is the best place to measure feed point VSWR I discussed location of the VSWR meter and projection of its reading to another point on a known transmission line.

One of the conclusions drawn in that article is:

Feed point VSWR can be estimated from measurements made at another place if the transmission line parameters are known. It, like all measurements, is subject to error but it may be a manageable error and indeed possibly better overall than direct measurement.

This article discusses some issues that may arise in referring measurements from one place to another (eg near transmitter to antenna feed point).

Characteristics of transmission line categories

Let’s consider two categories of transmission lines in terms of characteristic impedance Zo and propagation constant γ:

  • Lossless line; and
  • practical line.

A lot of theoretical analysis uses lossless line for simple explanations, and whilst for a lot of purposes, approximation of practical line as lossless line serves well, at other times the error may be significant.

Lossless Line

A Lossless Line has imaginary part of Zo equal to zero and the real part of γ equal to zero.

Practical line

A practical line has non-zero imaginary part of Zo and non-zero real part of γ, and these are frequency dependent.

Under standing waves, attenuation along a practical line is not uniform, in most practical applications conductor loss/m is higher than dielectric loss so loss is higher near current maxima than near current minima.

For the purpose of this article, it is the frequency dependence of Zo, particularly the non-zero imaginary part that is significant.

A model

A model of a load similar to a 7MHz half wave dipole fed with 10m of RG58A/U was created in Simsmith to provide a basis for discussion. Whilst the model is subject to some errors computation, it is much less than comparing two field measurements at both ends of a transmission line.

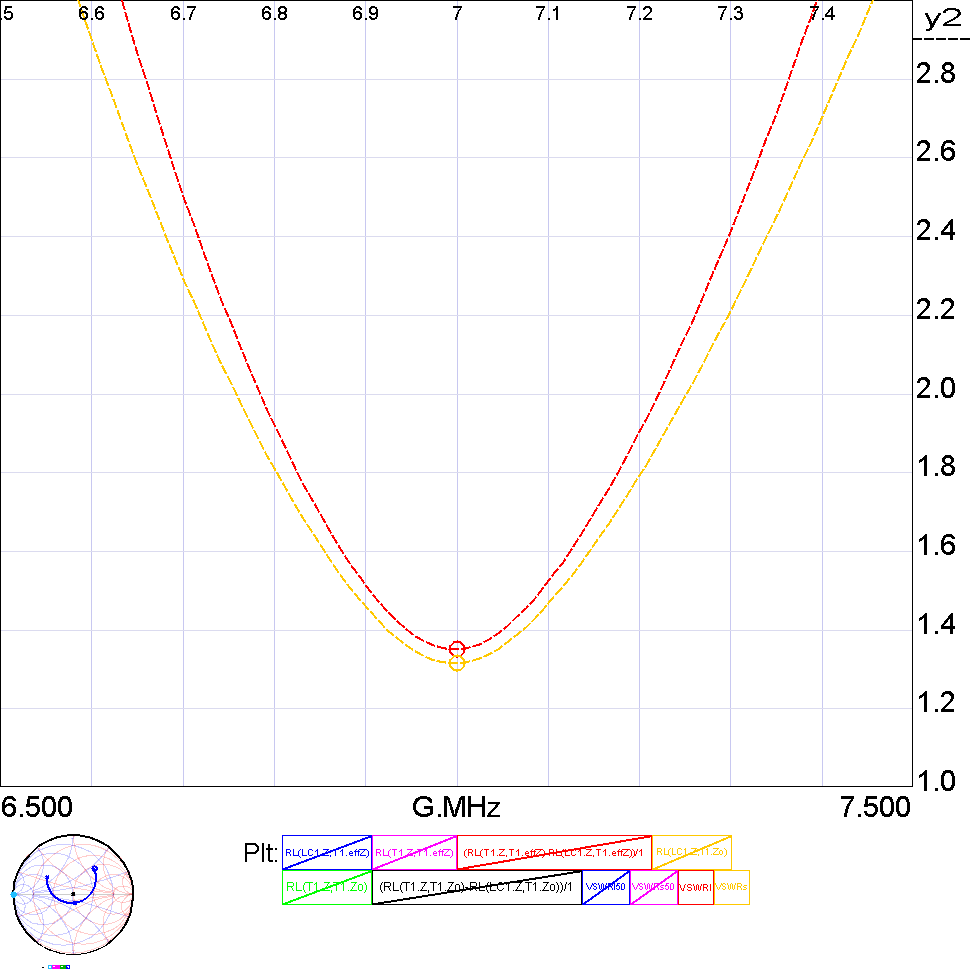
VSWR at each end of the transmission line

Let’s look at the ACTUAL VSWR. Actual means that if you were to observe the standing waves on the line (eg with a voltage probe), this is the VSWR you would expect to observe.

Firstly, observe that the source end VSWR (orange) is a little lower than the load end VSWR. This is by virtue of the attenuation on the line. The difference between the two can be calculated, but it is moderately complicated. Continue reading Where is the best place to measure feed point VSWR – error in Zo

Paccomm Tiny-2 Mk2 capacitor polarity problem

Many Paccomm Tiny-2 Mk2 TNCs have a polarised capacitor installed incorrectly. They become leaky and it degrades performance.

Let’s look at the datasheet for a MAX231 and review the charge pump and related filter capacitors.

Note especially the capacitor connected from pin 3 to ground, it is an electrolytic with -ve terminal to pin 3 and it develops the -ve voltage for the true RS-232 line driver. Continue reading Paccomm Tiny-2 Mk2 capacitor polarity problem

Can a diode be used to rectify signals smaller than its ‘threshold’ voltage?

Several articles on this site have used diode half wave detectors down to very low signal levels, well below the commonly perceived ‘threshold’ of the diodes, and it has prompted comments to the effect that this cannot work.

Really simple PN junction diode model

An ideal diode is a device that conducts in one direction with zero voltage drop, and does not conduct in the other direction.

Practical diodes typically have an IV characteristic with a knee at some small forward bias from about 0.2V to 0.6V depending on the nature of the PN junction.

An often used simple model of a practical diode is an ideal diode with a series battery of voltage equal to the offset of that knee, the ‘threshold’ if you like.

This model may be quite adequate when the applied voltage is much larger than the knee voltage, eg if you were rectifying 24V AC.

Practical diodes

Shockley’s diode equation

William Shockley modelled the IV characteristic of a diode as \(I_D=I_S(e^{\frac{V_D q}{n k_B T }}-1)\) where ID is the diode current, IS is the reverse-bias saturation current (or scale current), VD is the voltage across the diode, kB is Boltzman’s constant, T is absolute temperature, q is an elementary charge, and n is the ideality factor, also known as the quality factor or emission coefficient.

\(\frac{k_B T }{q}\) is often known as VT.

Shockley’s equation with n=1 is often known as Shockley’s ideal PN diode.

BAT46

Let’s look at the BAT46 Schottky diode, it has PIV=100V and is very suited to a lot of these higher voltage RF signal projects.

Above is the IV characteristic from a datasheet. They are often not very helpful at really low currents as used in some of these applications, but note the  great temperature sensitivity. Continue reading Can a diode be used to rectify signals smaller than its ‘threshold’ voltage?

Comparing RF Power Amplifier Tube Performance Computer and Calculate initial load line of valve RF amplifier on the AL811H

A correspondent wrote to me about Ameritron AL811H tube selection. The article contained a table of performance figures derived from RF Power Amplifier Tube Performance Computer calibrated for measured supply voltages and power output in the various modes.

Above is the table, Table 1 `from the article. Continue reading Comparing RF Power Amplifier Tube Performance Computer and Calculate initial load line of valve RF amplifier on the AL811H

Digital display for DIY 25W dummy load – part 4

Digital display for DIY 25W dummy load – part 1 described a  digital display for a DIY 25W dummy load / digital wattmeter. The original research tested implementations on an Arduino Nano (ATmega328P) and Arduino Mini Zero (ATSAMD21). Though the Zero appears the better chip (32bits, better ADC resolution etc), the dev board is so noisy (ADC wise) that the Nano produces better results.

Other candidate chips are those of the newer AVR chips, and to that end some ATtiny1614 chips were purchased for trial. Unfortunately I have not seen inexpensive dev boards and the chips are not available in DIP format, these are SOIC14 (SSOP14) 150mils.

Above is the result of this morning’s cooking… three ATtiny1614 chips on DIP style break out boards for prototyping. The chips were soldered in a T962 IR reflow oven. The very long unmasked sections of pad to accommodate different width chips make for a messy looking solder job as the solder runs along the long pads. Continue reading Digital display for DIY 25W dummy load – part 4

Digital display for DIY 25W dummy load – part 3

Digital display for DIY 25W dummy load – part 1 described a  digital display for a DIY 25W dummy load / digital wattmeter. The original research tested implementations on an Arduino Nano (ATmega328P) and Arduino Mini Zero (ATSAMD21). Though the Zero appears the better chip (32bits, better ADC resolution etc), the dev board is so noisy (ADC wise) that the Nano produces better results.

This article documents tests on three other dev board alternatives:

  • Arduino Nano Every (genuine);
  • Wemos SAMD21G board; and
  • Seeed XIAO mini Zero.

Baseline: Arduino Nano v3.0 (clone)

Above is the initial prototype Arduino Nano v3.0 (16MHz ATmega328P) with OLED display. This clone has a CP210x serial chip, clones with a claimed FTDI chip are probably fakes, ones with CH340x chips are probably ok. Continue reading Digital display for DIY 25W dummy load – part 3

FT37-43 for a 49:1 EFHW transformer enquiry

A correspondent asked whether Sontheimer coupler – transformer issues – an alternative design – FT37-43 could be used to inform design of a 49:1 EFHW transformer based on the same core, but with a 2 or 3t primary.

In the case of the Sontheimer coupler the winding with the higher number of turns appears in shunt with the nominal 50Ω load, and its effect on InsertionVSWR and the core loss can be predicted reasonably well and confirmed by measurements as in the referenced article.

In that instance, a 7t winding in shunt with the nominal 50Ω load causes excessive core heating, a 3t winding will be worse, and 2t worse again.

The case of an EFHW transformer is somewhat similar, the difference is now that the winding with less turns in approximately in shunt with the nominal 50Ω primary referred load. The same Simsmith model can be used to predict likely InsertionVSWR due to primary magnetising admittance, and the core loss.

Let’s try the 3t case first, with the experience of the referenced article we can expect it will have insufficient turns for good performance.

Above is the Simsmith model of a Fair-rite 5943000201 core (equivalent dimensions to FT37-43) with a 3t winding. Note this does not apply to Amidon #43 as their material is significantly different in characteristic. Continue reading FT37-43 for a 49:1 EFHW transformer enquiry

Digital display for DIY 25W dummy load – part 2

Digital display for DIY 25W dummy load – part 1 described VK4MQ’s build of a DIY 25W dummy load / digital wattmeter with very good performance. As part of the project, Bruce made an exhaustive set of measurements of Prf vs Vdc from 0.001W to 25W. A second order curve fit was calculated and is used in the instrument to transform measured Vdc to Prf for display.

That project was an elaboration of a design worked up at Digital display for QRP labs 20W dummy load – part 1 and following articles. That workup included an LTSPICE model of the half wave detector with BAT46 diode, 0.1µF capacitor and 56k+1k voltage divider. A second order curve fit was calculated and is used to transform measured Vdc to Prf for display.

This article compares the LTSPICE model data set, its curve fit, the measurements of Bruce’s implementation, and its curve fit. Continue reading Digital display for DIY 25W dummy load – part 2

Digital display for DIY 25W dummy load – part 1

Digital display for QRP labs 20W dummy load – part 1 and following articles laid out a initial study into the feasibility of an approach of a similar project. This project uses the same display solution for a DIY 25W dummy load / digital wattmeter with very good performance.

This article describes Bruce, VK4MQ’s, build.

Implementation

Bruce built the dummy load wattmeter into a small die cast box.

Above, the front panel view, the OLED display shows power in watts and dBm, and a bar chart display. The unit is battery powered, and has a on/off switch on the front panel. Continue reading Digital display for DIY 25W dummy load – part 1