This article explores the way in which VSWR varies along a feed line.
Actual VSWR
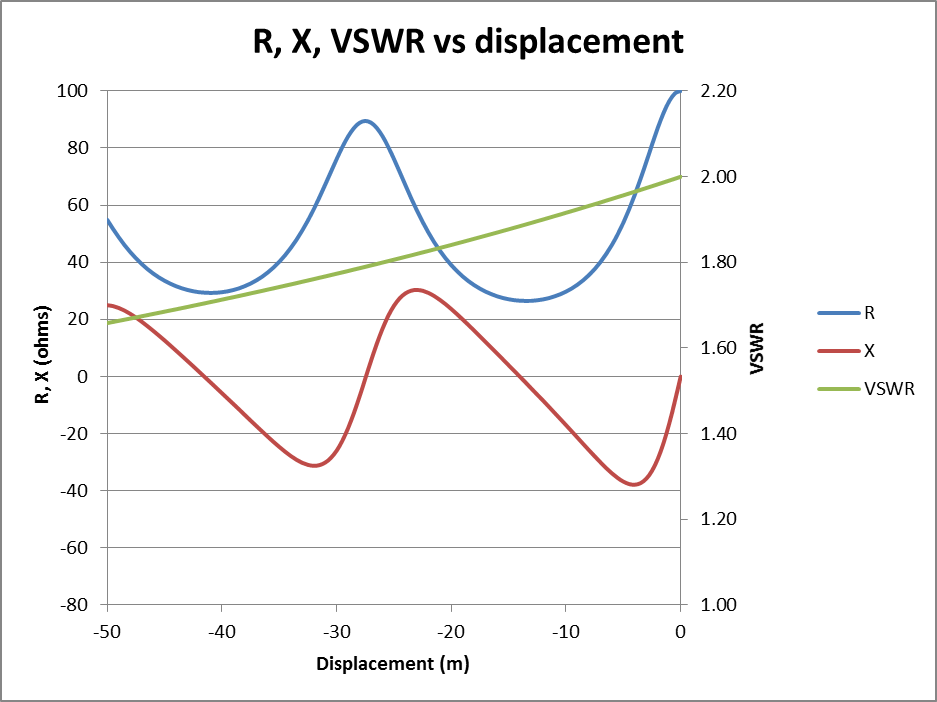
The graph above shows R and X, and VSWR along a feed line with a 100+j0Ω load at 3.6MHz. The feed line is Belden 8262 50Ω coax, manufacturing tolerances are taken to be zero, and the displacement is relative to the feed point, ie -ve distance is distance before the feed point, the feed point then is at the right hand side of the graph.
If you were to measure VSWR with an instrument calibrated for 75Ω, there would be error because the feed line characteristic impedance (Zo) is not 75Ω. Likewise, If you were to measure VSWR with an instrument calibrated for 50Ω, there would be error because the feed line characteristic impedance is not 50Ω, it is 50.02-j1.19Ω at this frequency.
Note that VSWR is the actual VSWR, it is that value that would be indicated by an accurate instrument calibrated for 50.02-j1.19Ω

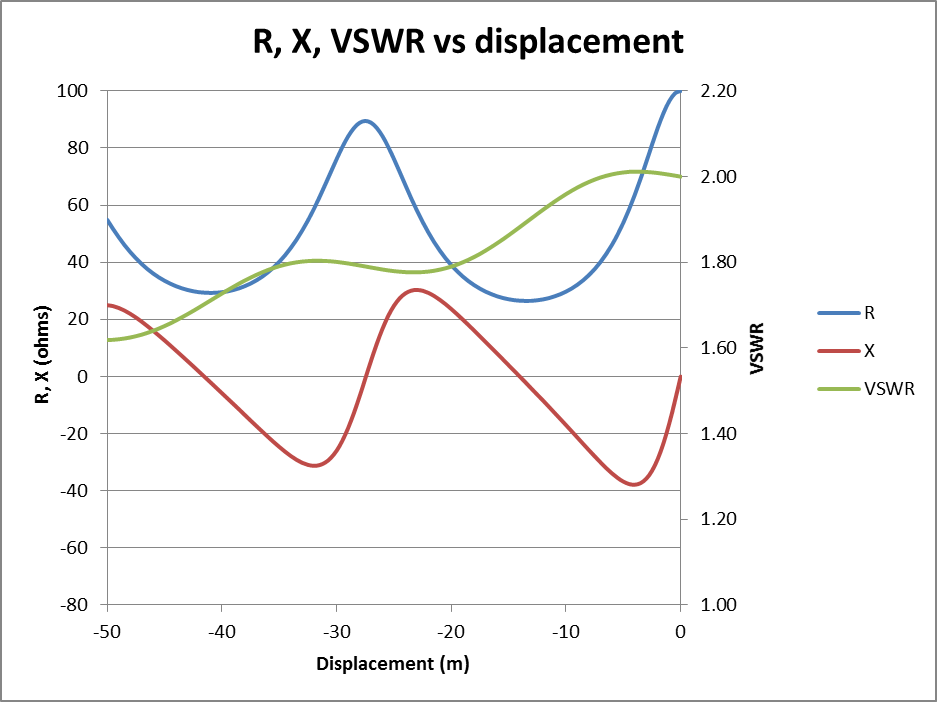
Above is the same plot for the load case of 25+j0Ω. Similar load VSWR, indeed the only line that appears identical is the VSWR line which decreases smoothly from load to source (ie right to left).
Apart from a very special case which you are unlikely to encounter in ham radio, VSWR decreases smoothly from load to source as caused by line attenuation.
Indicated VSWR
But we don’t usually use a VSWR meter calibrated for the actual Zo, but rather its nominal Zo… and in this case 50+j0Ω.
Above is the 100+j0Ω load case calculated for nominal 50Ω, ie VSWR50. Note the periodic variation in VSWR50.

Above is the 25+j0Ω load case calculated for nominal 50Ω, ie VSWR50. Note the periodic variation in VSWR50, and that it is opposite in phase to the previous case.
This periodic variation in VSWR becomes less pronounced as VSWR is reduced, ie it will be very hard to observe in practice at low VSWR.
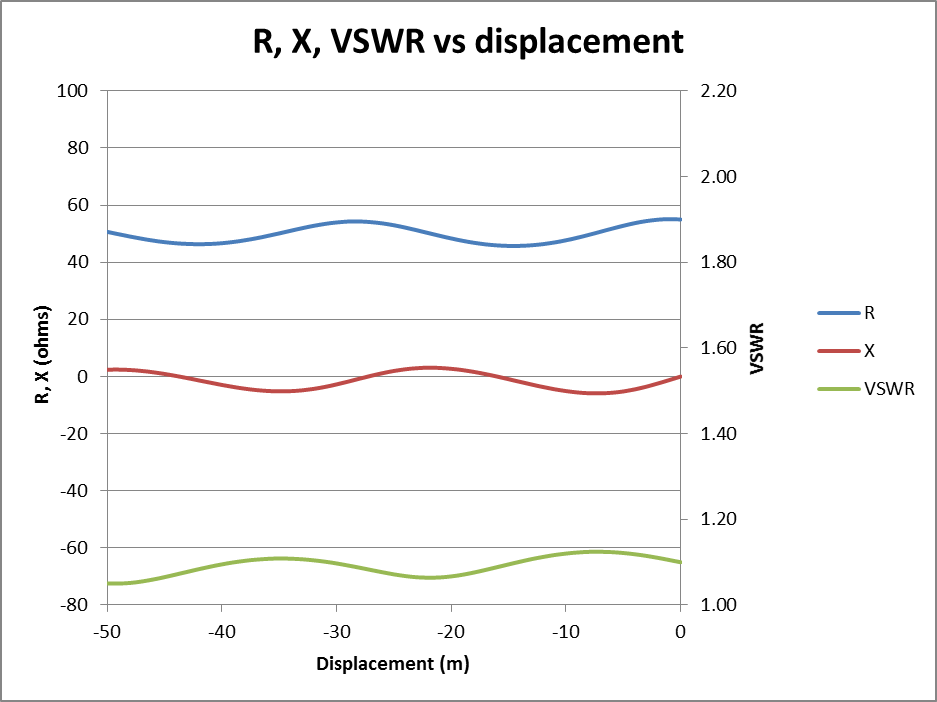
Above is the 55+j0Ω load case calculated for nominal 50Ω, ie VSWR50. Note the periodic variation in VSWR50 is now quite small ranging from 1.065 to 1.124 near the load and would be hard to observe reliably on practical instruments.
Note that indicated VSWR trends downwards from load to source, but modified by the cyclic variation due to difference between actual Zo and instrument calibration Zo.
Higher frequencies
The foregoing examples were chosen at 3.6MHz because the effects are clear.
As frequency is increased, the departure between actual Zo and nominal Zo for most cables diminishes.
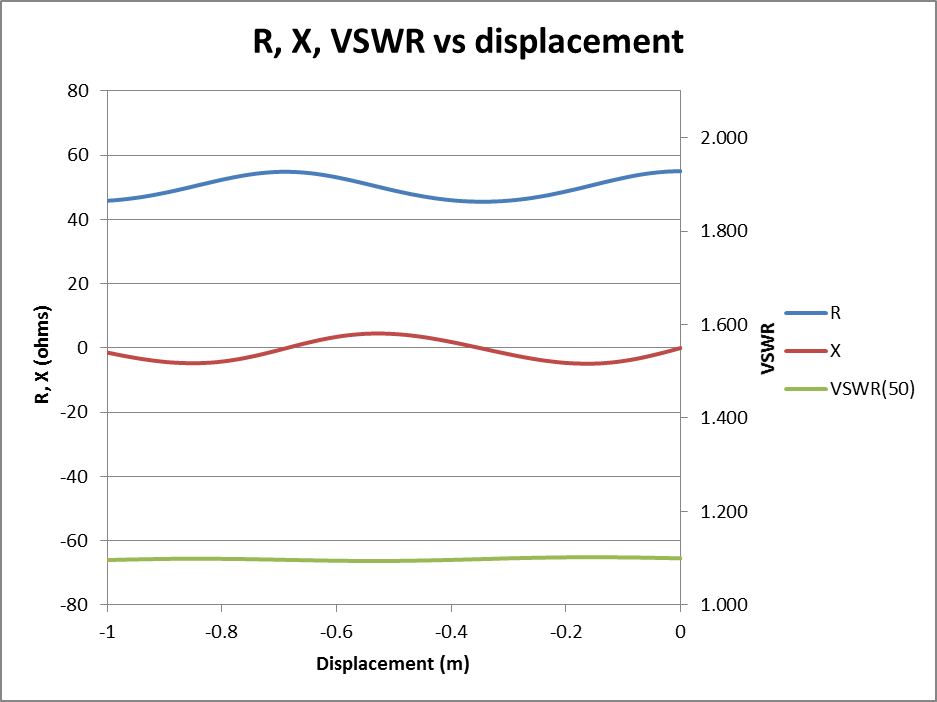
Above is the 55+j0Ω load case calculated for nominal 50Ω, ie VSWR50 at 144MHz. The VSWR50 is much less, ranging from 1.095 to 1.102 near the load and would be hard to observe reliably on practical instruments.
Conclusions
For the most part, VSWR observed with a practical VSWR meter calibrated for nominal Zo of a line will decrease smoothly from load to source, especially for low VSWR at higher frequencies.
Any variation is small, and if larger variation is observed in measurement, something else is going on.
The belief by many hams that changing the feed line length significantly changes VSWR due simply to transmission line behaviour is a popular ham myth promulgated out of ignorance of transmission line basics.