 |
| OwenDuffy.net |
|
Cecil Moore (W5DXP) has trolled various online fora with scan details of an
experiment that it appears he encouraged some anonymous students at Louisiana
Tech supervised by unnamed professor to conduct / supervise ((Moore 2011a)
W5DXP loaned his 75m Bugcatcher Loading Coil to Louisiana Tech University where
EE graduate students ran some simple measurements
and I was not present
for the measurements but will ask the question of the supervising professor at
Louisiana Tech
).
| |
Moore also introduced this experiment on the same day in another troll
entitled Brainteaser
(Moore 2011b) in which he said [h]ere's a graphic
of a black box containing one real-world component along with lab measurements
made on the current in and current out of the black box. What's in the black box
,
see Fig 1 above.
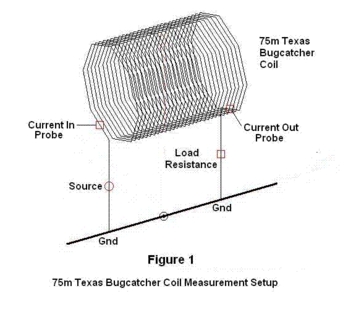 |
Moore offers the diagram in Fig 1 of the experimental setup. Sadly, there are no more detailed diagrams. descriptions, or photographs, so the reader is left guessing about the very important details of the nature of the 'Gnd' conducting bus or plane.
A long coil of wire parallel to and in close proximity to a ground conductor might be though of as having a distributed series inductance and shunt capacitance to ground. In a practical example, the conductor contains loss, and there would be some dielectric loss (though very small in the case of dry air). These R, L, G and C are the components of a transmission line, and the mathematical modelling of such is captured in the Telegraphers Equation.
Whilst the transmission line (TL) model might give good results for a long uniform coil, as the length of coil is reduced it may be adequately represented as a lumped component circuit. (Corum and Corum 2001) discuss this and the representation of the distributed inductance and capacitance in some equivalent lumped form, referring to the work of others.
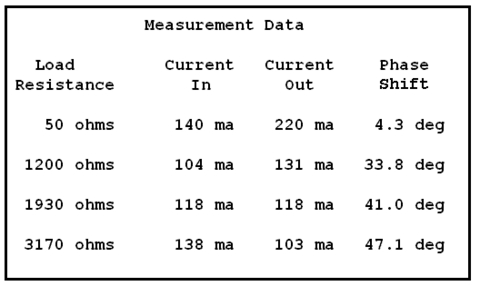 |
(Moore 2011a) does report the same measurements as in Fig 1, here at Fig 3,
with the description [k]eeping the source frequency constant at 4 MHz, for
four different load resistances, 50 ohms, 1200 ohms, 1930 ohms, and 3170 ohms,
the phase shift between the current into the coil and the current out of the
coil was measured
. He later states ...these measurements indicate that a
75m loading coil can be modeled as a transmission line with a high
characteristic impedance (Z0=~1930 ohms) and a very low velocity factor
(VF=~0.0193)
.
There are only four data points offered, insufficient to form any view about measurement error, and no estimate of error or confidence limits offered. Further, there is no evidence that the experiment showed that the effects observed were of the coil alone, that the environment (eg the position and nature of the ground bus shown in Fig 2) didn't contribute significantly to the measurements.
There is an assertion that the experiment represents a loading coil located in a centre loaded mobile whip. There is no supporting argument, and there is good reason to think that the distributed capacitance in the test fixture is quite different to that of a centre loading coil.
(Moore 2011a) has given the key parameters of a TL model, but has not solved it. He as given Zo as 1930Ω and velocity factor of 0.0193. The complex propagation constant γ of the TL has two components, α and jβ. In a lossless line, α=0, and β can be calculated from the velocity factor as 2*π*f/c0/vf=4.3rad/s. The complex reflection coefficient Γ can be calculated from the data give, Γ=(Zl=Zo)/(Zl+Zo). γ, Γ, and line length (0.165m from the coil data) allow calculation of a TL model which can be compared to the measured data.
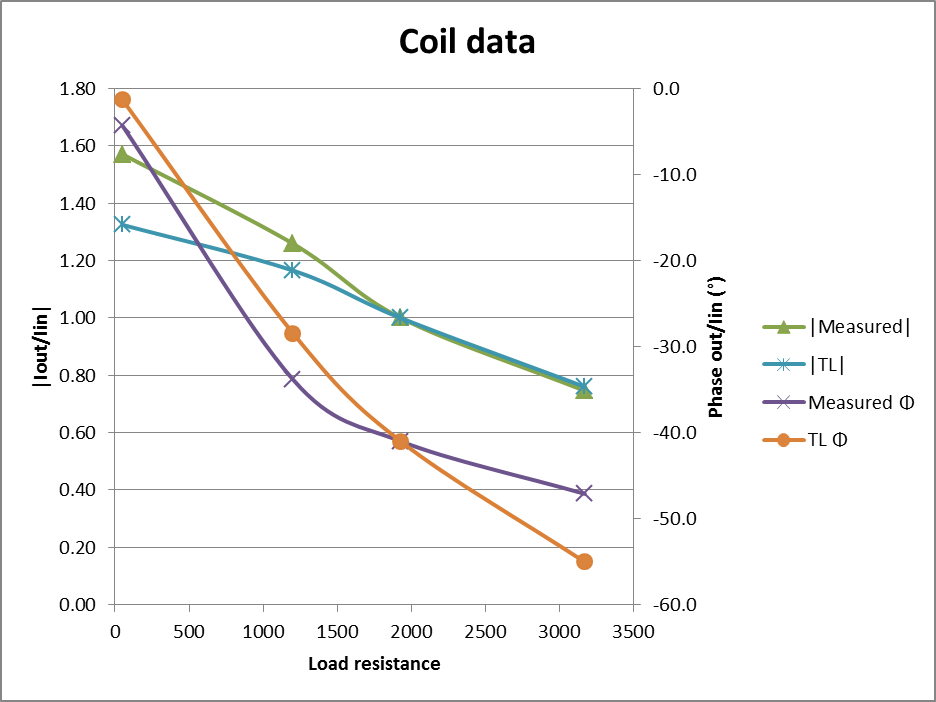 |
Fig 4 compares the TL model based on Moore's data with Moore's report of the
measurements. There is some similarity, but the models diverge on phase for high
load R, and magnitude for low load R. Note that the experimental data in Fig 3
reports phase shift between the current into the coil and the current out of
the coil was measured
, and the graphs show phase shift of Iout wrt Iin, so
are plotted with opposite sign.
The RMS error of magnitude is 0.13 and phase 5.02°.
Real inductors have distributed capacitance between turns, and possibly significant capacitance to nearby conductors. At RF, is is almost always necessary to allow for this distributed capacitance, and this is often done with one or more fixed capacitances.
In this case, because most of the capacitance will be between the coil and ground bus, a small capacitance is connected to ground from each end of the ideal inductor. The lumped component model used in this article for the coil structure used in the experiment is a low pass pi network with 67µH inductor and two 8pF capacitors.
The lumped component model is simple to calculate using quite basic AC circuit theory.
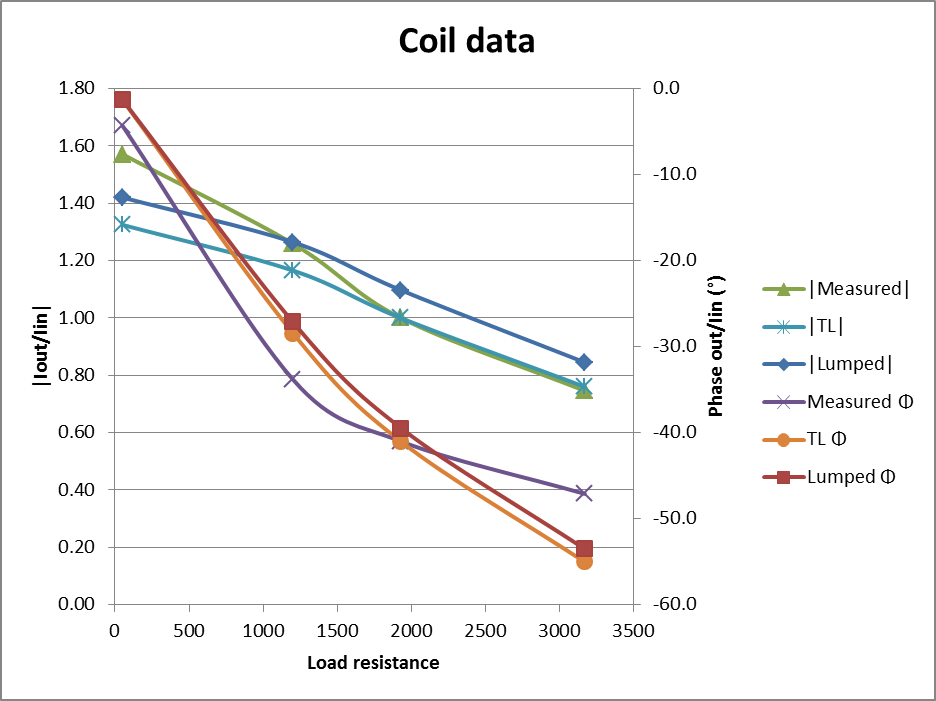 |
Fig 5 is Fig 4 with the addition of a calculated lumped component model. Of course, with more sections, the lumped component model will converge on the TL model.
The RMS error of magnitude is 0.10 and phase 4.93°, slightly better than the TL model.
Note the similarity in shape of the lumped component model and the TL model. It is not surprising, As (Corum and Corum 2001) explains, a short TL can be represented well by a lumped component model.
The more interesting thing is the basic difference in shape of the measured magnitude curve and both TL and lumped component magnitude curves; and measured phase curve and both TL and lumped component phase curves. The differences question the accuracy of the measurements.
(Moore 2011a)'s statement Conclusion Number Two: Any 75m air-core loading coil
must necessarily be in the ballpark of 30-45 electrical degrees long which falls
under the classification of a distributed network, NOT a lumped circuit
is
not supported by his paper. Though there is a lot of hand waving and wordy
discussion, there is no solution given for either model in the paper and the
conclusion is unsubstantiated.
The experimental data supports calculation of a TL model which Moore, with a lot of hand waving suggests is the better model, but does not actually show a TL model.
In fact, the three component lumped model presented in this article is a slightly better fit to the experimental data than the best TL model this author could derived from the experimental data.
The difference in the shape of the experimental data curves and both TL and lumped constant curves gives cause to review / rerun the measurements.
The experimental data does not support the proposition that a lumped component model is significantly poorer than a TL model for this structure.
The experiment is probably not a good representation of a coil in a centre loaded whip, and probably not directly relevant to that application.
After many months, the promised V2 of (Moore 2011a) has not appeared, yet Moore has take the time to troll in QRZ forums again (Moore 2012a) trying to incite anti W8JI sentiment yet again. The moderators of QRZ obviously nurture Moore and his likes.
The likelihood of Moore making any worthwhile technical contribution to the topic seems low, the topic seems more a vehicle for a personal vendetta.
After a further six months, still no updates on Moore's web site of his article. He trolls again on eHam (Moore 2012b) trying to bait people over his coil perspective.
So, the fact remains that his published data analysed above supports conventional lumped component analysis of his DUT as a better explanation than his transmission line method, and for which in a half baked approach he doesn't actually give any parameters. I say "his" rather loosely as it is actually someone else's experiment of which he has partial details.
A total waste of time that is not worth monitoring any further!
| Version | Date | Description |
| 1.01 | 18/11/2011 | Initial |
| 1.02 | ||
| 1.03 | ||
| 1.04 | ||
| 1.05 |
© Copyright: Owen Duffy 1995, 2021. All rights reserved. Disclaimer.