Accuracy of the FSM sampling process on noise
|
This article examines the contribution of the FSM sampling process to measurement error, and appropriate sample set sizes for given confidence limits. The proposed solution has application generally to high resolution measurement of bandwidth limited noise. |
Introduction
FSM determines the receiver input power in a known bandwidth based on measurements of the the RMS value of the receiver audio voltage. The RMS value is calculated from a set of samples of the instantaneous voltage.
It is apparent from repeated observations of the same source, that variation of a set of observations decreases with a larger sample set size, whether as a result of larger measurement bandwidth or longer measurement time. The sampling process appears to contribute to measurement error, and the contribution is related in some way to the sample set size.
The question then is how large a sample set size is required control the sampling error to an acceptable degree.
A Statistical solution
The noise voltage can be though of as a stream of instantaneous random values with Gaussian distribution, mean of zero, and standard deviation (S) equal to the RMS voltage. The power is proportional to the variance (s2) of these samples, and the constant of proportionality is 1/R.
The Nyquist-Shannon sampling theorem states that the noise voltage must be sampled at least at twice frequency of the highest frequency component of the bandwidth limited noise to fully capture the information it contains.
In statistical terms, we are taking a limited set of samples (N), calculating sample variance (s2) and using it to estimate the population variance (σ2), and hence the noise power in a resistor. We can never be absolutely certain that our set of samples will give the same variance as the population sampled.
We should expect that on repeated measurement of the same source, that there will be variation, and that a component
of that variation is the
chance selection of the set of samples on which the estimate was based. It seems reasonable to assume that taking
more samples should give us higher confidence that our estimate (the measured sample variance) is closer to the real
phenomena, the population variance (the actual noise power).
To make high accuracy or high resolution measurements, the confidence interval for the sampling process must be small relative to the desired resolution. The objective is to determine the number of samples (N) required for a given confidence interval for S2 relative to σ2.
The statistic Χ2 relates s2, σ2, and N. Χ2=(N-1)*s2/σ2, and the probability distribution of Χ2 is well known (see Chi-square distribution), so it provides a solution to the problem.
|
To find the minimum number of samples and minimum integration time for a confidence interval of ±0.1dB at a confidence level of 90% for a 2kHz bandwidth white noise source: An accuracy of ±0.1dB is required, 10^(-0.1/10)< s2/σ2<10^(0.1/10), or 0.977< s2/σ2<1.023 Next, find values of Χ2l and Χ2u with probability of 5% and 95% respectively for a 90% confidence interval. This is an iterative process as it depends on the number of samples.
If the noise source had bandwidth from 0Hz to BW Hz, then no more than 2*BW samples per second are needed to fully capture the information in the waveform. To obtain sufficient samples, the minimum integration time is 10091/2000/2 or 2.5s. If the ADC was sampling at a rate of 11.25kHz, then the minimum number of samples becomes 2.5*11,250 or 28,125. It should be noted that if the frequency band of the noise source were displaced, the sample rate must be at least twice the highest frequency. |
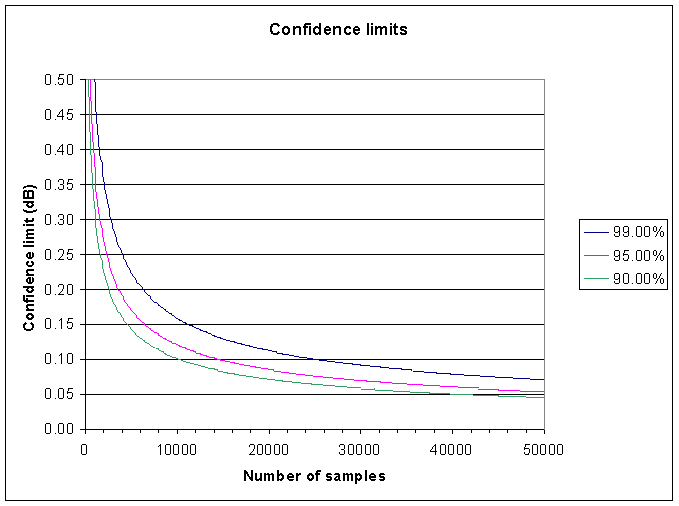
Figure 1 shows the confidence limits at three levels of confidence that are likely to be suited to high accuracy measurements of noise. Where the sound card sample rate is greater than 2* BW (default is 11,250Hz), then the number of samples must be multiplied by SampleRate/BW/2.
 |
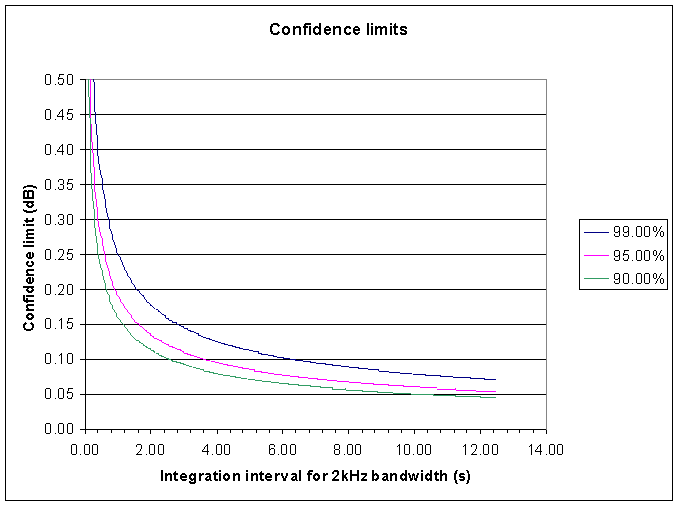
Figure 2 is similar, but instead of using the number of samples, it uses the integration time for a 2kHz bandwidth for the independent value.
 |
Dicke's formula
In looking for more information on the resolution of noise measurements, I found Dicke being quoted from a paper "The Measurement of Thermal Radiation at Microwave Frequencies. Rev. Sci. Instr. , vol. 17, 1946." Dicke estimates the sensitivity of a radiometer as the minimum detectable signal being the one in which the mean deflection of the output indicator is equal to the standard deviation of the fluctuations about the mean deflection of the indicator. He is quoted as saying:
mean(ΔT)= (Β * Tn) /( Δv * t)^0.5
where:
ΔT is the minimum detectable signal;
Β is a constant of proportionality that depends on the receiver and is usually in the range 1
to 2;
Tn is the receiving system noise temperature;
Δv is the pre-detection receiver bandwidth; and
t is the post detection integration time constant.
This suggests that an estimate of the error (in dB) due to the sampling process is 10*log(1+Β /(Δv * t)^0.5).
I do not have a derivation of Dicke's formula. It does seem to assume one dimension of the problem, the probability that a measurement falls within the calculated error bound. The factor Β seems to have been determined empirically, and may be in some way related to the degree of confidence.
I have plotted the above Dicke's formula at various values of Β, over the plots of Χ2/(N-1) (where N=Δv/2*t) at various confidence levels. Dicke's formula with Β=1 coincides with Χ2/(N-1) at a (two tailed) confidence level of of 84%. At large values of N, changing Β has identical effect to changing the confidence level in the Χ2/(N-1) estimate, so it appears that Β may have expressed the observer's assurance rather than some equipment attribute.
Links
FSM (Field Strength Meter) software