A recent post by David Knight described dimensional issues with the N connector on his AA-600 and problems with the seller in having it resolved.
Warned of a potential quality issue, I measured my own AA-600.

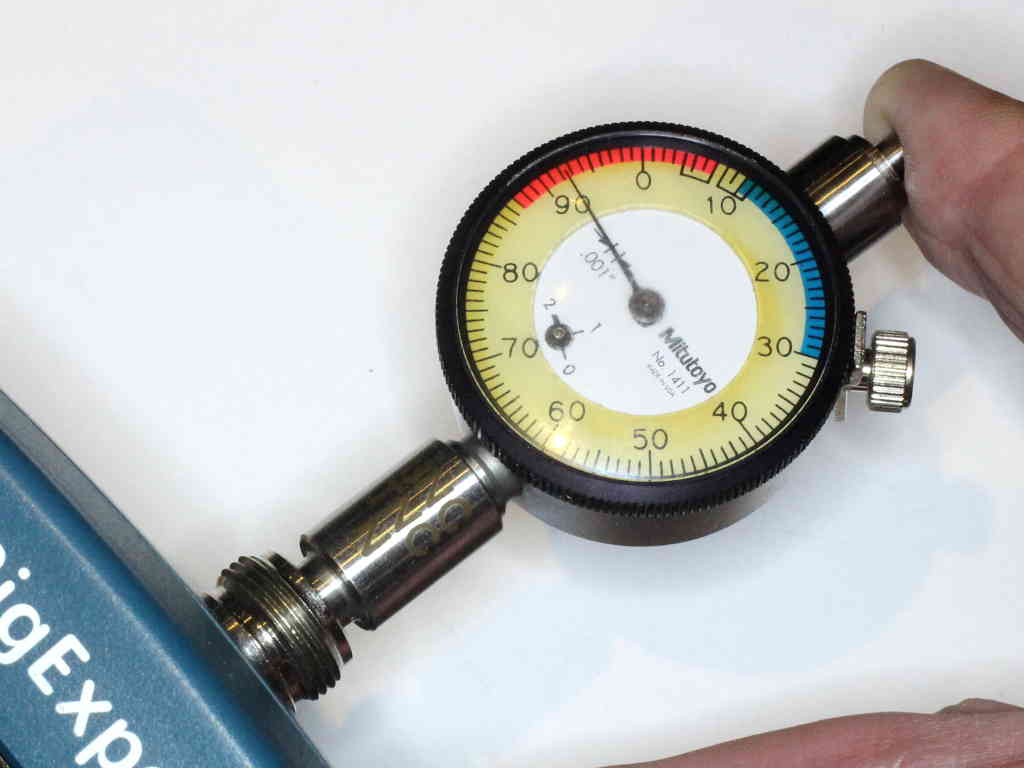
Above, the test of the inner pin forward surface distance from the reference plane on the N jack on the AA-600. The acceptable range on this gauge for the female connector is the red area, and it is comfortably within the red range.

Above is a table of critical dimensions for ‘ordinary’ (ie not precision) N type connectors from Amphenol.
This dimension is important, as if the centre pin protrudes too much, it may damage the mating connector.
Pleased to say mine is ok, FP at 0.192″.
I used a purpose made gauge to check this, but it can be done with care with a digital caliper (or dial caliper or vernier caliper), that is what I did for decades before acquiring the dial gauge above.
Last update: 12th June, 2020, 7:59 AM
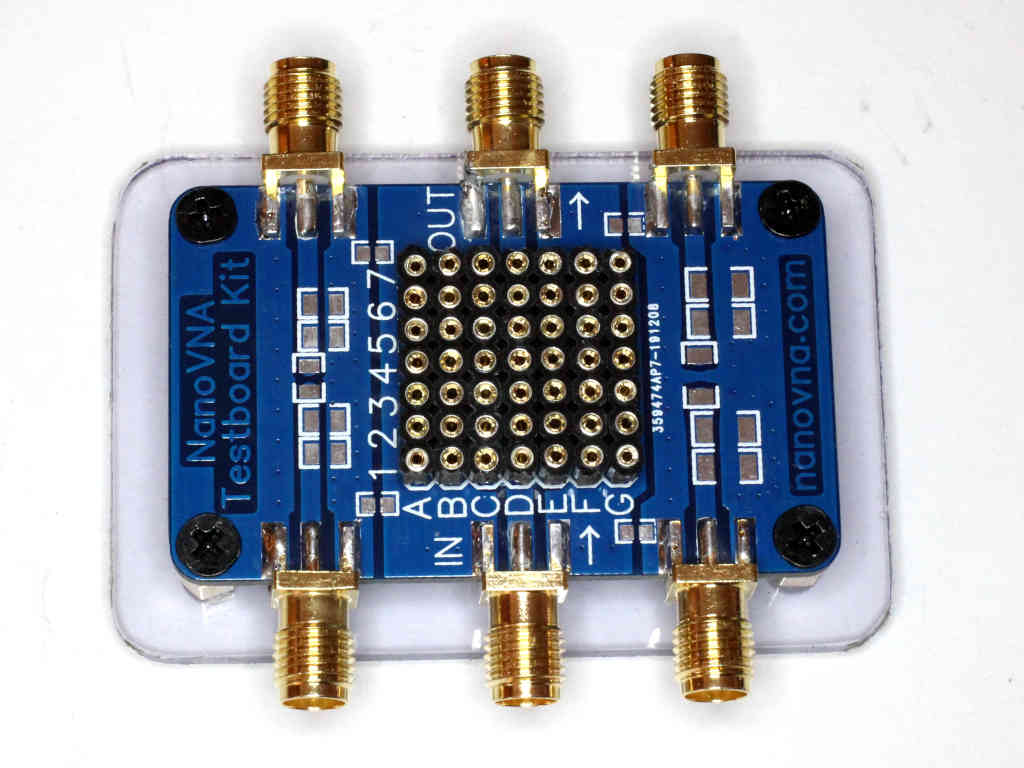 Above is the top view of the test jig mounted on a DIY PVC plinth. The test jig alone cost $17 on Aliexpress and took three months to arrive. Continue reading nanoVNA-H – Deepelec test jig