40m filter for WSPRlite flex

The WSPRlite flex requires external low pass filters for each band of operation.

Since my experiments will be conducted on the 40m band, the following low pass filter meets the requirement. The inductors and capacitors make a seven element Chebyshev filter as designed by G3CWI for use in a 50Ω system.

Implementation

Above, the filter is assembled on a piece of matrix board with two BNC connectors. The inductors are fixed with hot melt adhesive, and the whole thing served over with heatshrink tube. It is not waterproof. Continue reading 40m filter for WSPRlite flex

Another RFI mod of a speaker mic for DMR use

I bought a remote speaker-microphone (RSM) for a DMR portable from eBay (~$12 posted). Experience says that these suffer RF ingress which is seriously bad in DMR due to the amplitude modulation of the transmitted signal.

This RSM had somewhat improved filtering around the electret compared to others I have purchased. Continue reading Another RFI mod of a speaker mic for DMR use

RBN for antenna comparisons – Radcom 2018

There are a plethora of articles and presentations on the ‘net showing how to use the Reverse Beacon Network (RBN) to make quantitative antenna comparisons over real propagation paths.

It is certainly an interesting subject to most hams with a deep interest in antenna systems.

So called A/B comparisons of antennas are as old as ham radio itself, and experience hams know that they are quite flawed.

Because ionospheric propagation paths vary from moment to moment, the challenge is to make a measurement that is directly comparable with one made at a slightly different place, or frequency or time. Accuracy is improved by making several measurements, and finding a central value, more observations tends to reduce uncertainty in that estimate of the population central value.

The challenge is finding that central tendency.

Central tendency

There are three common methods of estimating the central tendency of a set of figures:

  • mean (or average);
  • median (or middle value); and
  • mode (or most common value).

The mean is a popular and well known measure of central tendency. It is a very good estimate of the central tendency of Normally distributed data, and in that case, we can compare means and calculate confidence levels for assertions about the difference between means. The mean is very susceptible to errors due to outliers, and skewed distributions.

The median is usually a better measure for skewed data.

The mode is if you like, the most frequent or popular value and has a great risk of being quite misleading on this type of data.

A recent article (Appleyard 2018) in Radcom provides a useful example for discussion.
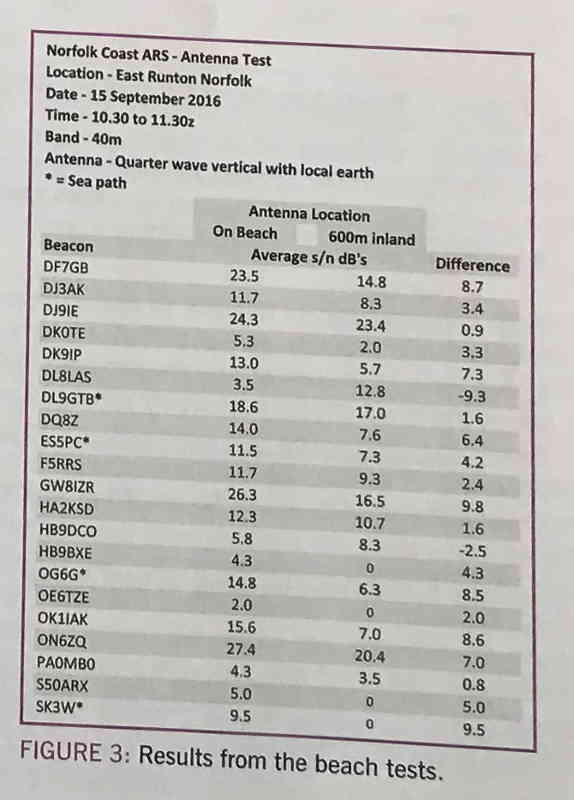
Figure 3

Appleyard gives a summary table where he shows means of a set of RBN measurements of signals from two stations observed at 21 remote stations, and differences in those means.

There are some inconsistencies between the text and data recorded in the RBN database on the day. Continue reading RBN for antenna comparisons – Radcom 2018

80m voltage fed Half Square matching workup

A correspondent wrote asking about the design of a matching network for a Half Square antenna for 80m, voltage fed at one end.

Above is the current distribution on the half square voltage fed. It is essentially two in-phase vertical quarter waves separated a half wavelength, a broadside array.

Feed point impedance at resonance is very high 5700Ω, and being a high Q antenna, they are very sensitive to dimensions, nearby clutter etc. Note that this is calculated for an antenna in the clear, it will be different where trees or conductive mast exist nearby. Continue reading 80m voltage fed Half Square matching workup

Ham grade analysers and VNAs often use unconventional meanings for well known terms

Lets use a simple test circuit to review the meaning of some oft misused terms associated with VNA and antenna analyser measurements.

Above, the test circuit is a nominally 220pF COG capacitor connected between tx and rx ports of a two port VNA. An extra 1Ω series resistance is included to model the likely effect of capacitor ESR. Continue reading Ham grade analysers and VNAs often use unconventional meanings for well known terms

Measuring ambient noise level using a spectrum analyser

The external noise figure Fa is defined (from ITU P.372-13) as:

I have taken a sweep of the 40m band when this is a little activity, but little enough to see the ambient noise floor at the time. It is raining and it is relatively noisy.

Above, the noise floor in 9kHz bandwidth with a CISPR quasi peak detector is about -78dBm. This is 12dB above the instrument noise floor, sufficient to not bother making a correction and we can take the external noise to be -78dBm (see below for correction calculation if needed). Lets allow 1dB loss in the antenna system, and call it -77dBm at the air interface.
Continue reading Measuring ambient noise level using a spectrum analyser

Surecom SW-102 VSWR meter review – v2.6

At Surecom SW-102 VSWR meter review I wrote a review of a meter which I had purchased a little over a year ago, it was at v4.5.

One of the many problems identified was inconsistency of displayed values.

v2.6

Surecom’s versions are confusing, the highest number is not necessarily the latest version. It appears a partial version history from their current page advertising the SW-102 is:

OLD VERSION : V3.3 ,V3.8 ,V4.5,V4.9 ,V5.0,V5.1
2017-8 NEW VERSION : V2.02 ,V2.03

The following image is from Surecom’s current page advertising the SW-102, and I assume that the version shown here (v2.6) is the latest at time of writing.

The image captures the outputs of two tests with poor and good dummy loads.

Let’s check the displayed values for internal consistency. Continue reading Surecom SW-102 VSWR meter review – v2.6

Is |s21| measurement of a common mode choke meaningful to antenna systems?

A common theme among online experts is to measure, or ask for measurement of a common mode choke connected between the centre conductor of a VNA’s tx and rx ports. That raises the question of whether |s21| with both ends shorted is meaningful, whether it in any useful way characterises the choke as a component of an antenna system.

Direct measurement of common mode current is not difficult, and it is almost always the best way to determine the effect of a choke on common mode current.

That said, analytical and simulation techniques can be of great value in the antenna design process, well before a prototype antenna is built.

An example choke at 7MHz

Lets perform an experiment using NEC to model the effect of a choke in a 7MHz antenna.

The choke used uses 11t on a FT-240-43 ferrite core. The values are from a calibrated model, values confirmed by measurement.

We will use NEC-4.2 with one of the scenarios detailed in the article Baluns in antenna systems, Model 4, but using the choke described above which has an impedance of 3175+j2502Ω at 7MHz.

Above is a simulation of the connection. Zcm of the choke in this case at 7MHz, 3175+j2502Ω, has been converted to an equivalent inductance and resistance to suit the simulator. (Note that the equivalent circuit it valid only for a narrow band, there is no simple wideband circuit equivalent for this ferrite cored choke (more later).) Continue reading Is |s21| measurement of a common mode choke meaningful to antenna systems?

4NEC2 plots of STL VSWR III

Conintuing from 4NEC2 plots of STL VSWR II, this article is a tutorial in using 4NEC2 to determine the Half Power Bandwidth of a simple model of the main loop.

The model is drawn from AA5TB’s calculator’s initial values.

The model is in NEC-4.2, and is a 20 segment helix in free space, and tuned for resonance at 7.000MHz. (If you repeat this using NEC-2, you may need fewer segments to avoid violating NEC-2’s segment limits.)
Continue reading 4NEC2 plots of STL VSWR III

4NEC2 plots of STL VSWR II (v5.8.16)

At 4NEC2 plots of STL VSWR I explained a method of working around a limitation of 4NEC2 values for Zo that can be applied using the Settings menu.

I asked the developer to consider a change, but I gathered that he regarded 4NEC2 to be at End Of Life.

It appears that 4NEC2 enforces a requirement that Zo>=0.1, so having discovered that by trial and error, one wondered if it was possible to change that threshold by hacking the exe file.

The IEEE754 Double representation of 0.1 is 0x3FB999999999999A, and of course it would be stored backwords in the exe file. Searching for 0x9A9999999999B93F found only one occurrence, offset 0x1490. That was changed to 0xfca0f1d24d62503f (the backwords representation of 0.001) and the exe tested. (It might be tempting to set it so zero, but that would permit entering zero which may cause run time errors). Continue reading 4NEC2 plots of STL VSWR II (v5.8.16)