End fed matching – PA3HHO design review #2


A correspondent having read End fed matching – design review raised a similar design by PA3HHO which uses a#43 ferrite toroid as part of an end-fed matcher, see Multi band end-fed (English).

Further to End fed matching – PA3HHO design review , this article has a solution to PA3HHO’s “original 40/20/10 version” using FT140-43 with a 2t primary.

Continue reading End fed matching – PA3HHO design review #2

Updated: Calculate initial load line of valve RF amplifier

Calculate initial load line of valve RF amplifier was written as a companion to my RF power amplifier tube performance computer tool to provide a starting point for building a model, but as it turns out, the initial load line (and related values) is a very good estimate and further modelling may not be needed.

Although written for an application to valves, it is quite applicable to any active device, keeping in mind that it assumes a linear transfer characteristic.

The update provides for both single ended and push-pull configurations.

For example, the requirement is for a single ended Class C bipolar amplifier to deliver 25W from a 13.8V DC supply. What is the ratio for a broadband output transformer to 50Ω.

Screenshot - 13_02_16 , 08_51_22

Above is the solution. The required Rl is 3.3Ω, and the required turns ratio is (50/3.3)^0.5=3.9. a 1:4 (turns) transformer would be selected for a prototype. Bear in mind that output power would fall to around 20W at 12V DC supply.

Another example is the common 100W 13.8V Class B push-pull design.

Screenshot - 13_02_16 , 09_22_26

With a requirement for around 3Ω collector to collector (or drain to drain), a transformer with 1:4 turns ratio would be selected.

Red Ironbark picnic table

I made a couple of picnic tables about 35 years ago. The design was broadly inspired by picnic tables deployed by the ACT administration at the time (local government), it used a galvanised water pipe frame for table and integral seats and hardwood tops.

IMG_0484a

I kept one of these tables, and the hardwood eventually degraded sufficiently to warrant replacement.

Durable timber has become very expensive, and the choice limited. Red Ironbark (a eucalypt endemic to the forests south east of here), GOS (green off saw) and DAR (dressed all round) was chosen, and stacked in the shed for a couple of years to dry down to 10% moisture content.

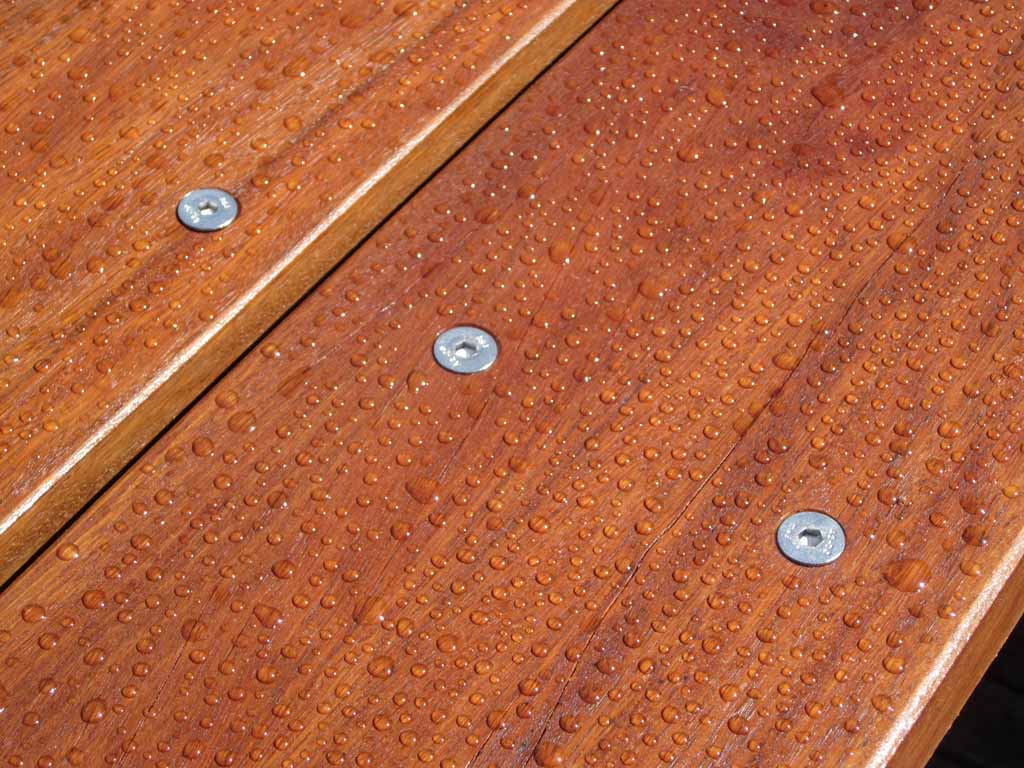
The timber was washed down, trimmed and edged, drilled and oiled (Organoil, a naturally drying oil mix), and fixed to the table with 304 stainless countersunk socket head M8 screws and nyloc nuts.

PicnicTable

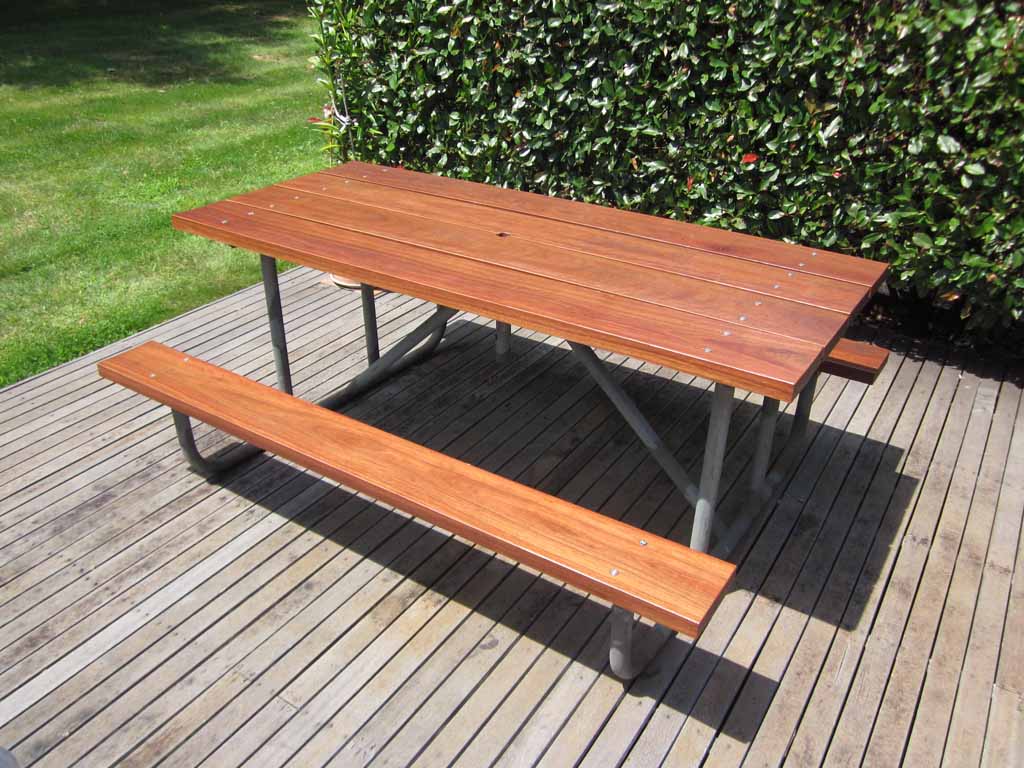
Above, the refurbished table. Total mass is 125kg, about half of that is in the hardwood and the rest in the steel frame.

The table will required replenishment of the oil finish every year, but should be a durable non-toxic lasting finish with that maintenance.

Identifying ferrite materials #2

A correspondent wrote about Identifying ferrite materials asking how to use the method on an analyser that does not display X, but displays R and |Z|.

The method described calls for making a winding of the least number of turns for which measurement can reasonably be made, and finding the lowest frequency where R=X.

If your analyser does not display X (or |X|), you can exploit the relationship that |Z|=(R^2+X^2)^0.5. When R=X, |Z|=1.414R… so you would look for the lowest frequency where |Z|=1.414R.

Having found that, compare it with the table given or datasheet graphs to find candidate mixes.

Reconciling my #52 choke design tool with G3TXQ’s measurements

A correspondent wrote with concern of the apparent difference between graphs produced by my #52 choke design tool with a graph published by G3TXQ of his measurement of 11t on a pair of stacked FT240-52 cores.

I published a note earlier about my concerns with a similar graph by G3TXQ compared to the Fairrite datasheet, and he reviewed the data, found the error and published a corrected graph.

FT240-52x2-11t

The corrected graph above might at first glance appear different to my model’s graphs, and the first obvious difference is that G3TXQ uses a log Y scale (which is less common). The effect of the log scale is to compress the variation and give the illusion perhaps that in comparison with other plots, this balun has a broader response.

Screenshot - 09_02_16 , 18_29_42

To compare the two, I have roughly digitised G3TXQ’s graph above and plotted the data over that from my own model (with linear Y scale). Continue reading Reconciling my #52 choke design tool with G3TXQ’s measurements

Identifying ferrite materials

This Jan 2012 article has been copied from my VK1OD.net web site which is no longer online. It is for reference from other related articles. The article may contain links to articles on that site and which are no longer available.

One often wants to identify the type of material used in a ferrite core for use at radio frequencies. This article captures advice that the author has offered in online fora stretching back more than a decade, yet it seems uncommon knowledge.

The most common method is to make some measurements to determine the initial permeability µi, usually at audio frequencies, and to compare that to a table of µi for common core materials. This method might well indicate several mixes that have similar µi, but each may be quite different at higher frequencies.

The suitability for use at RF usually depends much more on complex permeability at radio frequencies than it does on µi at say 10kHz.

cf01Above is a plot from the Fair-rite data book showing the complex permeability characteristic of #43 ferrite material. Continue reading Identifying ferrite materials

Exploiting your antenna analyser #14

Insertion Loss, Mismatch Loss, Transmission Loss

A correspondent asks about the effect of RCA connectors at HF on his proposed noise bridge. The question is very similar to that considered at Exploiting your antenna analyser #13 for UHF series connectors.

I have made a simple measurement of a BNC 50Ω termination (to check calibration) then inserted a BNC-RCA and RCA-BNC adapter.

Measurements of input impedance only for such an electrical short transmission line will not give useful data for determining TransmissionLoss which is the result of conversion of RF energy to heat. The measurements do give ReturnLoss and given that InsertionLoss=MismatchLoss+TransmissionLoss, they set a lower bound for InsertionLoss.

To jump to the chase, it also has a Smith chart plot up to 200MHz that suggests it might be well modelled by a TL segment of 30-35Ω.

Screenshot - 07_02_16 , 16_58_55

Above is a plot of VSWR when Zref is adjusted for the flattest response from DC, and it can be seen that with Zref=33, response is quite flat to 200MHz. Continue reading Exploiting your antenna analyser #14

Low Insertion VSWR HF Guanella 1:1 balun for instrumentation

The article describes a current balun intended for measurement use with low power instrumentation. It is lightweight and can be made with materials readily available in Australia (LF1260 cores are a little over $1 each in packs of six). The target application is for a 600mm square small loop for field strength measurement below 15MHz.

Design

The design is an implementation of (Duffy 2007) which used RG174 coax for the choke to give low Insertion VSWR.

The balun is intended for low power measurements and will withstand dissipation of a few watts.

The LF1260 cores are made from a medium µ ferrite and have an ID of 7.8mm.

Screenshot - 12_01_2015 , 20_08_34

Above, the cores will accommodate four round conductors of diameter 3.2mm, so they will comfortable accommodate the four passes of RG174 (2.5mm dia). (For the mathematically minded, the minimum enclosing circle diameter for four equal circles is 1+√2 times the diameter of the smaller circles.)

Implementation

LF1260Balun101Above, the balun cores  are housed in a small Jiffy box with a BNC-F flange mount connector at one end and a pair of M4 screw terminals at the other. Small brass tabs were made as non-rotating terminal tags and the M4 brass screws soldered to them. The cores are attached to each other with a piece of double-sided foam tape to prevent them shattering, and two pieces of the same used to secure the cores to the box. A packing between the cores and lid helps to hold them in place.

As discussed at Baluns – show me the numbers, implementation details without quantitative models or measurement are of little value. Continue reading Low Insertion VSWR HF Guanella 1:1 balun for instrumentation

APRS duplicate removal – trial #2

The undetected long-delayed duplicate posits that are a feature of APRS VHF are a significant corruption of mapping.

Program code has been written to collect posit records direct from APRS-IS and where the record contains a HMS timestamp (as mine do), to apply a timestamp consistent with that timestamp, and then to not write records with duplicate timestamps to the database.

Screenshot - 04_02_16 , 15_57_38

The above map has two journeys, one a loop to the north of home to Mittagong, and another SW to Marulan and back. The Marulan trip extended to 40km from the prominent digi VK2RHR-1, and coverage in the area became poor, evidenced by the poorer APRS mapping in that region.

The map can be browsed interactively at https://owenduffy.net/map/showkmz.php?map=20160204 . The red trace is APRS VHF derived using the processing detailed below.

OpenLog07

The cyan trace is from stand alone GPS logger above attached to the case of the TinyTrak 3+. The transmitter is 65W output to a quarter wave in the middle of the wagon roof. Continue reading APRS duplicate removal – trial #2