A tutorial on estimating the impedance of a toroidal ferrite cored inductor for radio frequencies

This article is a walk through of a process for designing a toroidal ferrite cored inductor for radio frequencies.

Designing with magnetics can be a complicated process, and it starts with using reliable data and reliable relationships, algorithms, and tools. Continue reading A tutorial on estimating the impedance of a toroidal ferrite cored inductor for radio frequencies

W3LPL’s paired WSPRlite test – test 2

Frank, W3LPL conducted two interesting experiments with WSPRlites on 20m from the US to Europe essentially.

The first experiment was a calibration run if you like to explore the nature of simultaneous WSRP SNR reports for two transmitters using different call signs on slightly different frequencies simultaneously feeding approximately the same power to the same antenna.

This article is about the second test which he describes:

The second test uses a WSPRlite directly feeding the same stacked Yagis, and the second WSPRlite feeding nearly identical stacked Yagis that point directly through the other stack located four wavelengths directly in front. Power at each antenna was about 140 milliwatts for each WSPRlite.

The data for the test interval was extracted from DXplorer, and the statistic of main interest is the paired SNR differences, these are the differences in a report from the same station of the two signals in the same measurement WSPR interval.

There is an immediate temptation of compare the average difference, it is simple and quick. But, it is my experience that WSPR SNR data are not normally distributed and applying parametric statistics (ie statistical methods that depend on knowledge of the underlying distribution) is seriously flawed.

We might expect that whilst the observed SNR varies up and down with fading etc, that the SNR measured due to one antenna relative to the other depends on their gain in the direction of the observer. Even though the two identical antennas point in the same direction for this test, the proximity of one antenna to the other is likely to affect their relative gain in different directions.

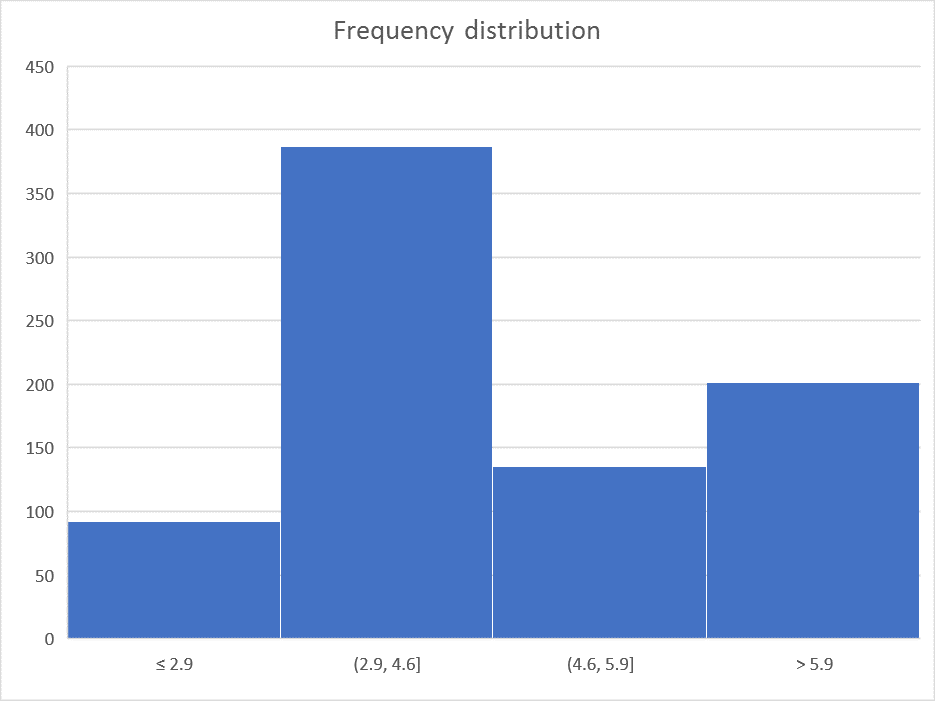
What of the distribution of the difference data?

Above is a frequency histogram of the distribution about the mean (4.2). Each of the middle bars (0.675σ) should contain 25% of the 815 observations (204). It is clearly grossly asymmetric and is most unlikely to be normally distributed. A Shapiro-Wik test for normality gives a probability that it is normal p=4.3e-39.

So lets forget about parametric statistics based on normal distribution, means, standard deviation, Student’s t-test etc are unsound for making inferences because they depend on normality. Continue reading W3LPL’s paired WSPRlite test – test 2

Rigexpert’s Antscope takes a step backwards

AT Measuring balun common mode impedance – #1 I gave an example of the use of a Rigexpert AA-600 to measure the common mode impedance of a current balun.

Screenshot - 31_01_2015 , 06_08_57

Above is a plot from that article. I cannot be sure what version of Antscope was used to create the graph, but it was no later than v4.2.57, as one of the ‘improvements’ of v4.2.62 and v4.2.63 was to reduce zooming of the Z scales to a maximum of 600Ω. Continue reading Rigexpert’s Antscope takes a step backwards

Signed application programs

There is some advantage in publishing digitally signed applications, so I have updated the distributions for FSC (Field Strength Calculator , FSM (Field Strength Meter), and (NFM) Noise Figure Meter to sign both the installer and the application executable.

Since it is only addition of a signature, the versions have not been updated, and the update will not trigger the new version detection built into the applications.

See Digital document signatures for information on getting the CA certificate for which you will then want to edit the trust settings.

There was a quite recent update to FSM v1.11.0, and a more recent update to add the signatures.

The signatures give you confidence about the origin of the installer, and that it has not been intercepted by one of the download sources that wrap the software in an adware enabled installer (eg OpenCandy). Always download my software from my site, there are NO authorised distributors!


AIM 865A Refer to Antenna facility

AIMuhf

I used an AIMuhf for Measuring balun common mode impedance – #2 using the SOL calibration facility.

AIM also claims to have a means of backing out a known transmission line between reference plane and DUT. This article discusses use of AIM’s Refer to Antenna facility.

AIM’s developer recently said of AIM’s Refer to Antenna facility:

Version 882 does have a problem with the Refer to Antenna function. Version 865A can be used for this function.

This function does have it’s limits though. It should only be used for good quality coax. The impedance and velocity factor of coax is not constant over the whole length and this limits the accuracy. Also the impedance may not be equal to the “nominal” impedance in the catalog. The impedance of 50 ohm cable can vary quite a bit. AC6LA.com has some interesting data showing how coax parameters vary with frequency.

Custom cal is much better when it is possible to put the cal loads at the far end of the transmission line. This takes into account variations in impedance, velocity factor, and loss and it can be used when there is coax and ladder line in one transmission line system.

Continue reading AIM 865A Refer to Antenna facility

AIM 865A produces inconsistent / incorrect results


AIMuhfAt Measuring balun common mode impedance – #2 I mentioned a glitch on the AIMuhf scan that appears to be a defect of the instrument / client software and that it undermines confidence in the system.

The article documents a test of a known load to attempt to prove the measurement system good. Continue reading AIM 865A produces inconsistent / incorrect results

Measuring balun common mode impedance – #2

At Baluns – show me the numbers I raised the value of quantitative measurement of the complex common mode impedance of current baluns as a figure of merit for certain antenna applications.

At Measuring balun common mode impedance – #1 I showed a technique that can be used with a common antenna analyser that properly measures impedance (including the sign of reactance).

This article demonstrates a simple method of measuring the complex common mode impedance of a Guanella 1:1 current balun using a one port VNA, though of course the technique is equally applicable to a two port VNA.

This article shows a simple method of measuring the complex common mode impedance of a Guanella 1:1 current balun using a modern Antenna Analyser.

The instrument used for this demonstration is a AIMuhf with AIM 865A PC client. This is back level software as I have demonstrated AIM 882 produces internally inconsistent results. Continue reading Measuring balun common mode impedance – #2

Measuring balun common mode impedance – #1

At Baluns – show me the numbers I raised the value of quantitative measurement of the complex common mode impedance of current baluns as a figure of merit for certain antenna applications.

This article shows a simple method of measuring the complex common mode impedance of a Guanella 1:1 current balun using a modern Antenna Analyser.

The instrument used for this demonstration is a Rigexpert AA-600, and its PC client Antscope. Continue reading Measuring balun common mode impedance – #1

Baluns – show me the numbers

Hams talk at length about baluns but rarely in quantitative terms.

A quotation from Lord Kelvin is most appropriate: When you can measure what you are speaking about, and express it in numbers, you know something about it. But when you cannot measure it, when you cannot express it in numbers, your knowledge is of a meagre and unsatisfactory kind. It may be the beginning of knowledge but you have scarcely in your thoughts advanced to the state of science. Continue reading Baluns – show me the numbers