Recent comments elsewhere on the shape of the plot of measured Q from (Austin et al 2014) gave reason to explore the behaviour of Q for a ‘good’ Small Transmitting Loop (STL) using an NEC-4.2 model.
The term Small Transmitting Loop means a loop sufficiently small that there is not a significant departure from smaller loop behaviour. Essentially this is true for perimeter less than about λ/10.
NEC-4.2 model
Key parameters are:
- Octagonal loop of 20mm copper with area equal to that of a 1m diameter circle, loop perimeter=0.104λ at 10MHz;
- centre height=2m;
- Qcap=2000;
- ground=0.007/17; and
- freq=1-10MHz.
This is a quite practical small transmitting loop with current that is approximately uniform around the loop.
Model results
The results are sensitive to all the model parameters, different assumptions may produce significantly different outcomes.
All impedance values are referred to the main loop feed point.
Following is a plot of the elements of total input resistance:
- Rl=loop conductor resistance;
- Rc=capacitor equivalent series resistance;
- Rgnd=equivalent ground loss resistance; and
- Rrad=radiation resistance.
Radiation resistance means the ratio of power radiated (ie in the far field) by an antenna to the square of the RMS antenna current referred to the feed point.
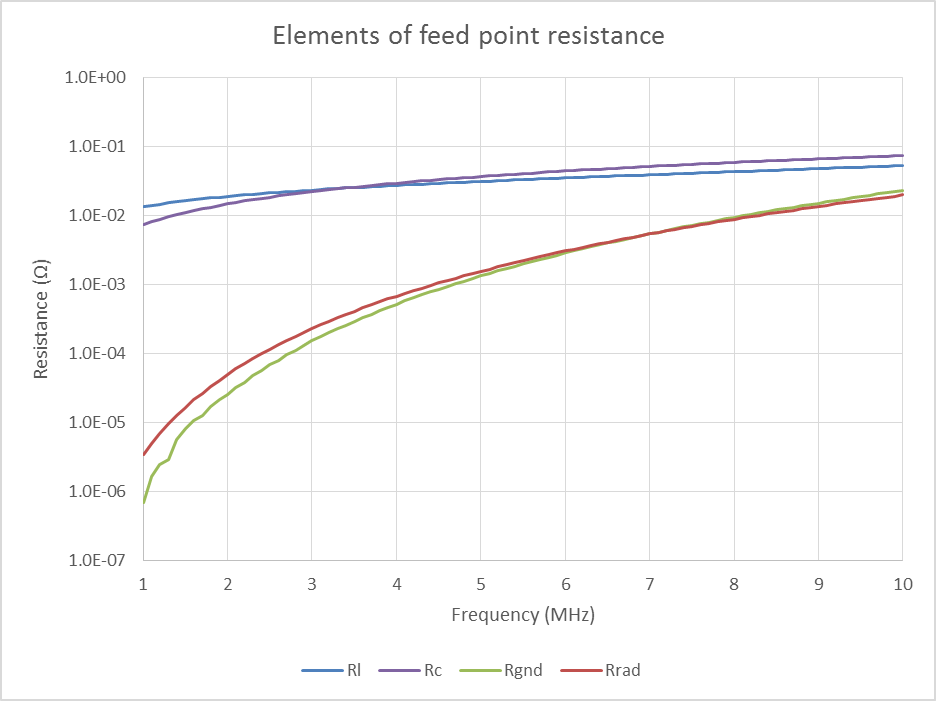
Above, the four elements on log scale.
If you look closely at Rrad and Rgnd, you will note that at 7MHz and above, Rgnd>Rrad which means that even if the structure was lossless, radiation efficiency is less than 50%.
At all frequencies shown, structure losses (Rl+Rc) are much greater than Rrad, so efficiency is limited to a maximum of 12% which occurs at 10MHz.

Above is the calculated Q based on the loop inductance and total input resistance from the model.
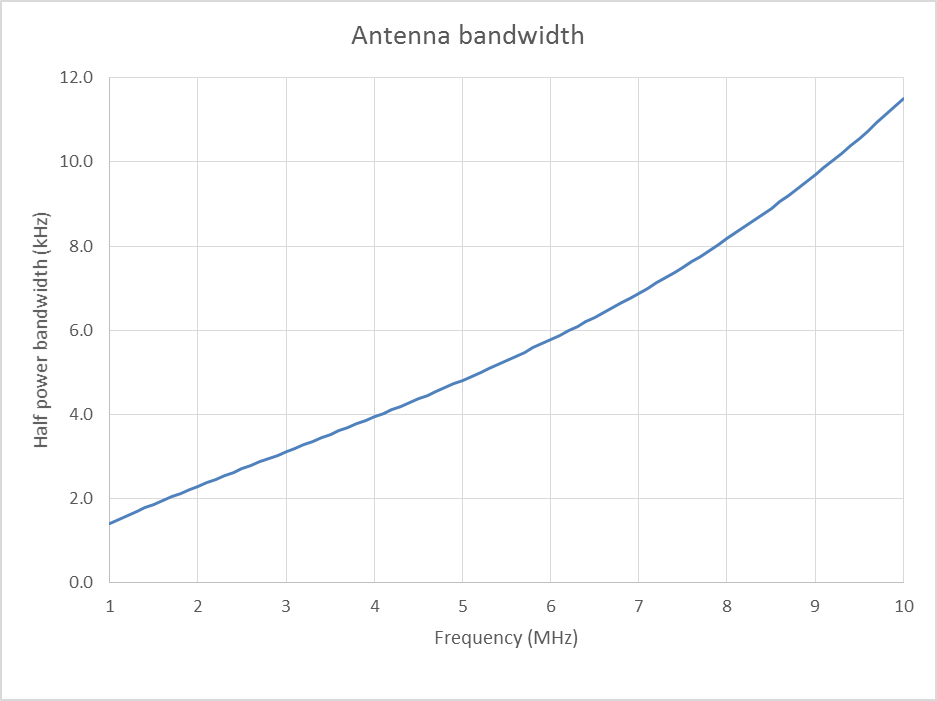
Above is a plot of half power bandwidth (VSWR=2.62). Note that VSWR=1.5 is a common threshold for PA protections circuits, and the VSWR=1.5 bandwidth is just 41% of the half power bandwidth, eg just 2.8kHz at 7.1MHz.
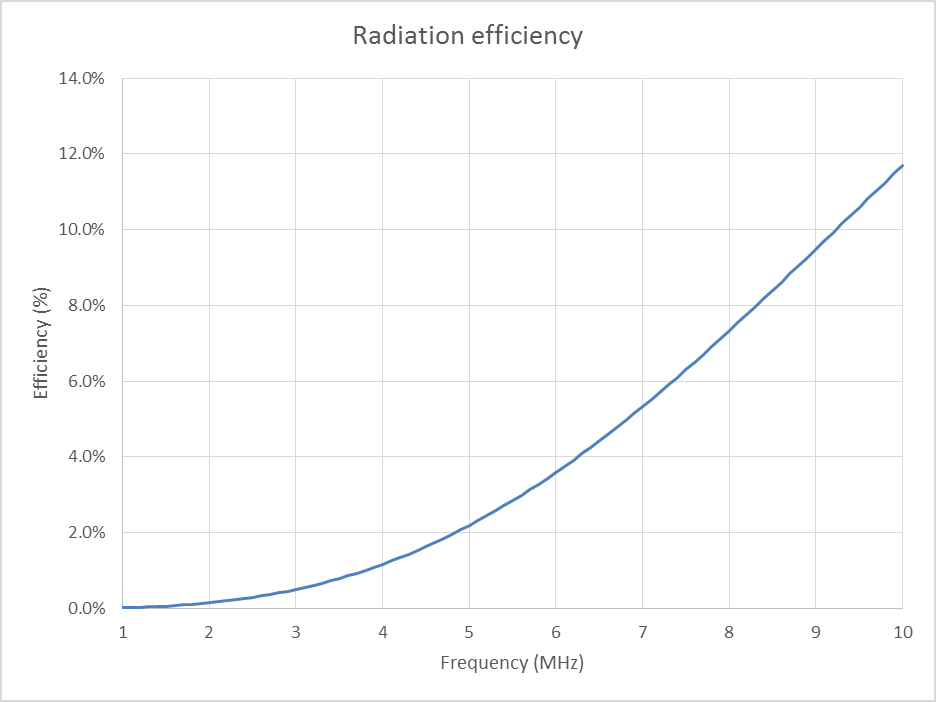
Above is a plot of radiation efficiency (the ratio of the total power radiated (in the far field) by an antenna to the net power accepted by the antenna from the connected transmitter).
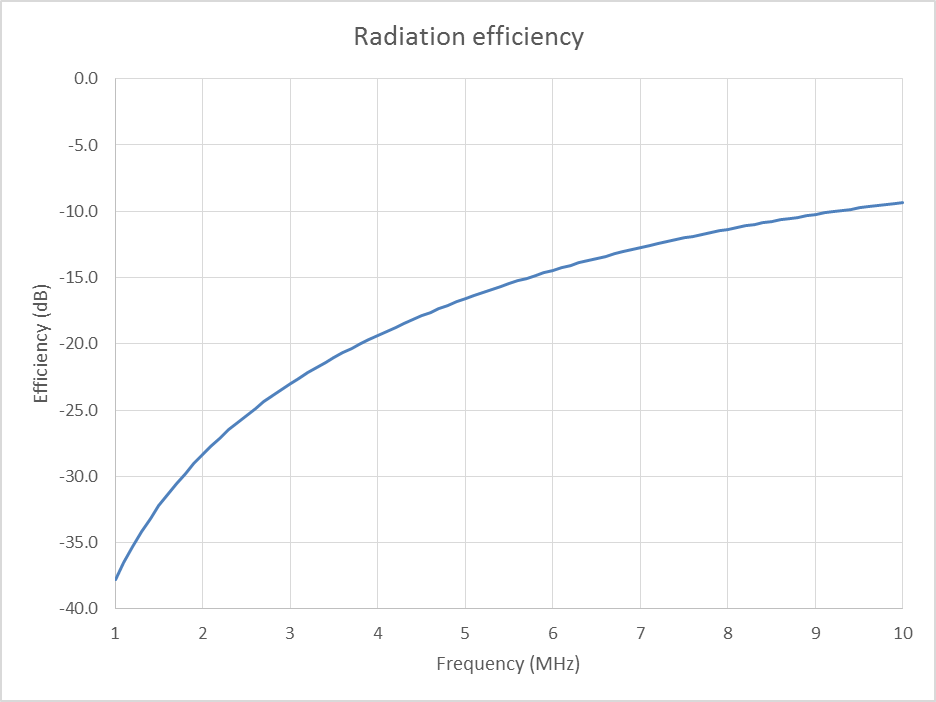
Above, radiation efficiency expressed in dB.
Real world differences
There are some important differences between the model and real world antennas:
- if the performance of a real loop of this size achieved that of the model, the loop might have such narrow bandwidth as to be impractical;
- high Q capacitors are not likely to have constant Q, eg the ESR of a vacuum variable cap is typically not simply inversely proportional to capacitance;
- matching networks introduce some further loss and reduce efficiency;
- expectations of efficiency greater than 50% even at perimeter=λ/10 are unrealistic;
- articles describing loop of similar size tend to report considerably wider bandwidths suggesting considerably poorer efficiency;
- measurement gives real insight, and nothing in this theoretical study questions Austin et al’s plot of measured Q.
References
- B Austin, A Boswell, M Perks. Aug 2014. Loss mechanisms in the electrically small loop antenna. Antennas and Propagation Magazine, IEEE (Volume:56 , Issue: 4 ) http://www.awasa.org.za/index.php/downloads/file/91-loss-mechanisms-in-the-electrically-small-loop-antenna (accessed 05/02/2015)